Research guide
Cell Signaling Diagram Arrow Meanings: Symbols for Research Papers
Learn cell signaling diagram arrow meanings, distinguish activation from transport, and define inhibition, dashed lines, and symbols in a clear figure legend.
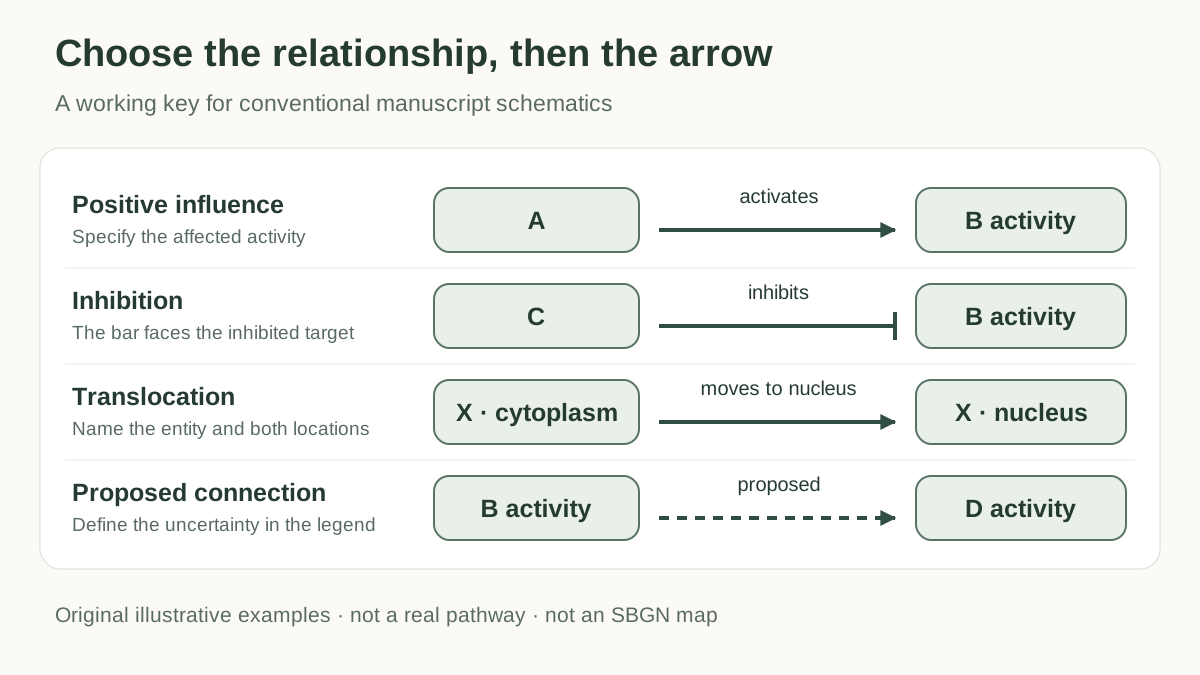
Cell signaling diagram arrow meanings depend on the figure's notation and legend. For a conventional paper schematic, a pointed arrow can represent a positive influence, a blunt bar can represent inhibition, and a labeled arrow can show transport or a transformation. Choose the meaning before choosing the shape. A reader should be able to tell what changes, where it changes, and how much the figure actually claims.
This guide is for researchers drawing a mechanism figure, thesis diagram, or review schematic. The examples are original illustrations with generic entities. They describe visual conventions, not an experimentally established pathway or an SBGN-compliant map.
Cell signaling diagram arrow meanings: a working key
Use the table as a starting key for an ordinary manuscript schematic. It is an editorial convention to define in your own legend; it does not replace a formal notation or your journal's instructions.
| Relationship you need to show | Suggested representation | What to make explicit |
|---|---|---|
| Positive influence on an activity | Pointed arrow, labeled “activates” or “promotes” | Target activity and whether the connection is direct |
| Negative influence on an activity | Line ending in a perpendicular bar | What activity or process is inhibited |
| Material transfer or translocation | Directional arrow between labeled locations | Which molecule moves, from where, and to where |
| Conversion or a state change | Arrow between separately labeled states | The change, such as phosphorylation; distinguish its regulator |
| Binding or complex formation | Labeled connection or explicit complex | Which participants associate; avoid implying activation |
| Proposed connection | Dashed connection plus an explanatory label | The exact uncertainty, supported by the caption or source |
| Label pointing to a structure | Leader line without a pathway arrowhead | Keep it visually separate from biological relationships |
Figure 1. An example legend for a conventional schematic. Labels supply the meaning that an arrow shape alone cannot establish. These are illustrative relationships, not a real pathway.
Separate activation and inhibition from what your data measure
An activation arrow makes a claim about an effect on the target. Before drawing one, finish the sentence “A increases the activity of B under these conditions.” If your result instead concerns B's abundance, localization, or measured signal, label that quantity. “Increases B expression” and “activates B” are different statements.
Place the arrowhead near the intended target. An inhibition symbol should end with its bar facing the target activity or process. If the target node includes several functions, name the affected function beside the connection rather than leaving the reader to infer it.
Keep directness separate from the positive or negative sign. A positive response after a perturbation does not, by itself, specify direct binding or a single molecular step. For a summarized route, “promotes, via omitted intermediates” may express your intended abstraction. Use it only when that route has a basis in your sources or findings.
Draw feedback as a returning connection with a clear source and target. Curving the line makes room for the layout; the curve itself does not identify the mechanism. Label the feedback effect, and keep it outside the main sequence when this makes the reading order easier.
Distinguish transport, binding, and phosphorylation
A translocation arrow describes movement. Show the same named entity at the origin and destination, add compartment labels, and label the movement. An arrow from “Protein X, cytoplasm” to “Protein X, nucleus” should not silently change into a claim that X activates the nucleus. If transport has a direction only under the study condition, state that condition.
For a reaction or state transition, show the states you intend to distinguish. A phosphorylation schematic might connect “Protein X” to “Protein X–P,” with “phosphorylation” beside the transition. If a particular site matters, use its verified name. A generic P marker does not specify a residue, prove kinase activity, or tell a reader whether the phosphorylation activates or inhibits the protein.
Binding is another relationship. A connecting line labeled “binds” can be sufficient for a simplified schematic. If the bound complex drives the next step, draw and name that complex. Do not make a single unlabeled arrow do the work of binding, complex formation, and downstream activation.
Two arrowheads also need explanation. They might be intended to show a reversible transformation, two directions of transport, or reciprocal influence. Write the intended relationship in the legend. For reciprocal regulation with different effects, use two separately labeled connections so their sources, targets, and signs remain visible.
These distinctions help determine the right figure type. Use the Scientific Illustration Generator for a mechanism draft you will check against your evidence. If the task is to relate study variables or constructs, use the Conceptual Framework Generator and describe the hypothesis rather than borrowing molecular notation.
Explain dashed lines and the level of evidence
Dashed arrows need a definition in the figure legend. In your schematic, you might reserve them for a proposed connection, or for a route with intermediates omitted. Those are different meanings. Pick one, or add labels that distinguish them.
Do not treat a dashed arrow as an automatic declaration of “indirect” or “unproven.” Nor should a solid arrow be the only indication that a mechanism is established. For each relationship, record the source or experiment and the claim it supports before drawing. Keep that record with the working figure so a collaborator can review it.
A useful relationship record has five fields: source entity, target entity or process, relationship, study context, and evidence reference. If the source concerns one cell type or condition, keep that scope when summarizing it. Missing evidence should lead to a qualified label or removal of the connection, not an invented citation.
When SBGN is the appropriate notation
SBGN defines three complementary languages: Process Description, Entity Relationship, and Activity Flow. Activity Flow summarizes influences between activities; Process Description represents processes and state transitions. Choose the language to suit the information being represented. SBGN specifications
Formal SBGN symbols have specific meanings and connection rules. For example, an SBGN stimulation arc has an empty arrowhead; an inhibition arc ends in a bar. In Process Description, these regulatory arcs target a process node, rather than replacing a substrate-to-product connection. SBGN symbol reference
For a standards-based map, follow the selected language's specification and use suitable validation tools. Ordinary shapes with a convincing appearance are insufficient to claim conformance. The simplified illustrations in this guide are conventional paper schematics. Learning SBGN
Arrange endpoints so the biology remains readable
Set the main reading direction before routing connectors. Left to right or top to bottom usually provides a useful starting layout; compartments may require a different arrangement. Keep the location of an entity biologically meaningful even when another placement would make the drawing more symmetrical.
Inspect every endpoint at the intended publication size. The arrowhead or bar should clearly belong to one target and should not cover its name. A line that passes behind another node can look as though it acts on that node. Reroute it or leave enough space to make the intended destination obvious.
At crossings, avoid junction-like intersections unless the lines truly join. When a connection branches, show the branch deliberately and verify each target separately. Keep label leader lines lighter or otherwise distinct from the pathway connectors, with the difference explained when needed.
Use color as a secondary cue. The arrowhead, bar, line style, and label should retain meaning in grayscale. Keep connector weights consistent unless their differences have a stated purpose. BioRender's pathway drawing guide also emphasizes consistent connectors, information flow, scale, and color readability. BioRender: Drawing Biological Pathways
A worked schematic: one claim per connection
Suppose your illustration needs to communicate three ideas: a positive influence of A on B activity, an inhibitory influence of C on that activity, and a proposed connection from B activity to D activity. These generic letters are placeholders; they make no claim about a named signaling pathway.
Start with A and B activity on the main row. Point A's connector at B activity and label it “promotes.” Place C below, route its connection upward, and let the inhibition bar face B activity. Route the proposed B-to-D connection with a dashed line and label it “proposed.” Repeat that meaning in the legend. The three relationships are now distinguishable without using color.
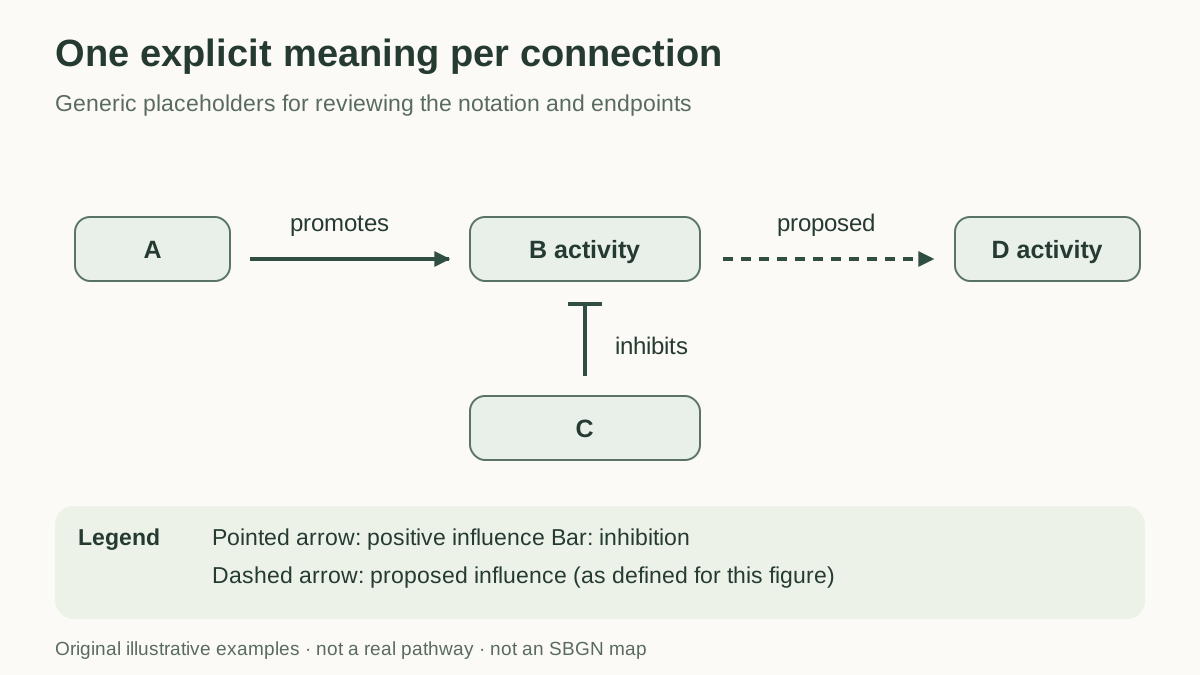
Figure 2. Generic relationships with explicit endpoints and a matching legend. A, B, C, and D are illustrative placeholders, not experimental findings. This is not an SBGN map.
If D subsequently moves into a nucleus, show that as a separate translocation relationship between compartments. Do not extend the same “proposed influence” arrow across the nuclear boundary and expect it to communicate both regulation and movement.
Review a draft before using it in a paper
- Write the claims first. Make the relationship record and identify the figure's single main message.
- Choose the notation. Define an ordinary figure key, or select a formal language and follow its rules.
- Label changes precisely. Separate activity, abundance, binding, state changes, and movement.
- Check the rendered figure. Trace sources and endpoints, inspect crossings, and review labels at final size and in grayscale.
- Review against the evidence. Ask a subject expert or coauthor to compare every connector with the cited source or finding, then update the legend and caption together.
For an AI-assisted draft, supply a checked relationship list and instruct the tool to preserve it. A prompt can specify the main reading direction, compartments, and legend, but generated connectors and labels still need review. For example:
Draw an illustrative schematic using only these generic relationships: A promotes B activity; C inhibits B activity; B activity has a proposed influence on D activity. Use pointed arrows for positive influences and bars for inhibition. Use a dashed line only for the proposed link. Label each relationship and include a matching legend. Do not add entities, mechanisms, or experimental results.
For the wider submission workflow, see how to make figures for research papers.
FAQ
What do arrows mean in a cell signaling diagram?
Their meaning comes from the notation and legend. A pointed arrow may show positive influence, transport, or conversion; label the relationship and identify its source and target.
What does a blunt arrow mean in a signaling pathway?
A line ending in a perpendicular bar commonly represents inhibition in a conventional pathway schematic. Identify the target activity or process and define the symbol in the legend.
Does a dashed arrow always mean an indirect interaction?
No. Define its meaning in the figure legend. A proposed connection and a route with omitted intermediates are different meanings and need distinct explanations.
Does phosphorylation mean a protein is activated?
Not by itself. Show the verified state change and label the effect on activity separately when it is supported by your evidence.
Can an AI-generated pathway be treated as SBGN-compliant?
Only after it satisfies the selected SBGN language's symbol and connection rules and has been checked accordingly. A similar visual style or an AI prompt is insufficient to establish compliance.
Make the legend part of the figure
Clear cell signaling diagram arrow meanings come from matching each connector to a precise claim, checking its endpoint, and defining its meaning in the legend. Bring your reviewed relationship list to the Scientific Illustration Generator to draft the figure, then verify the resulting symbols and caption before submission.