ExplainViz library
Free Diagram & Chart Generators
Focused scientific-visual tools for papers, dissertations, and conferences.
Research
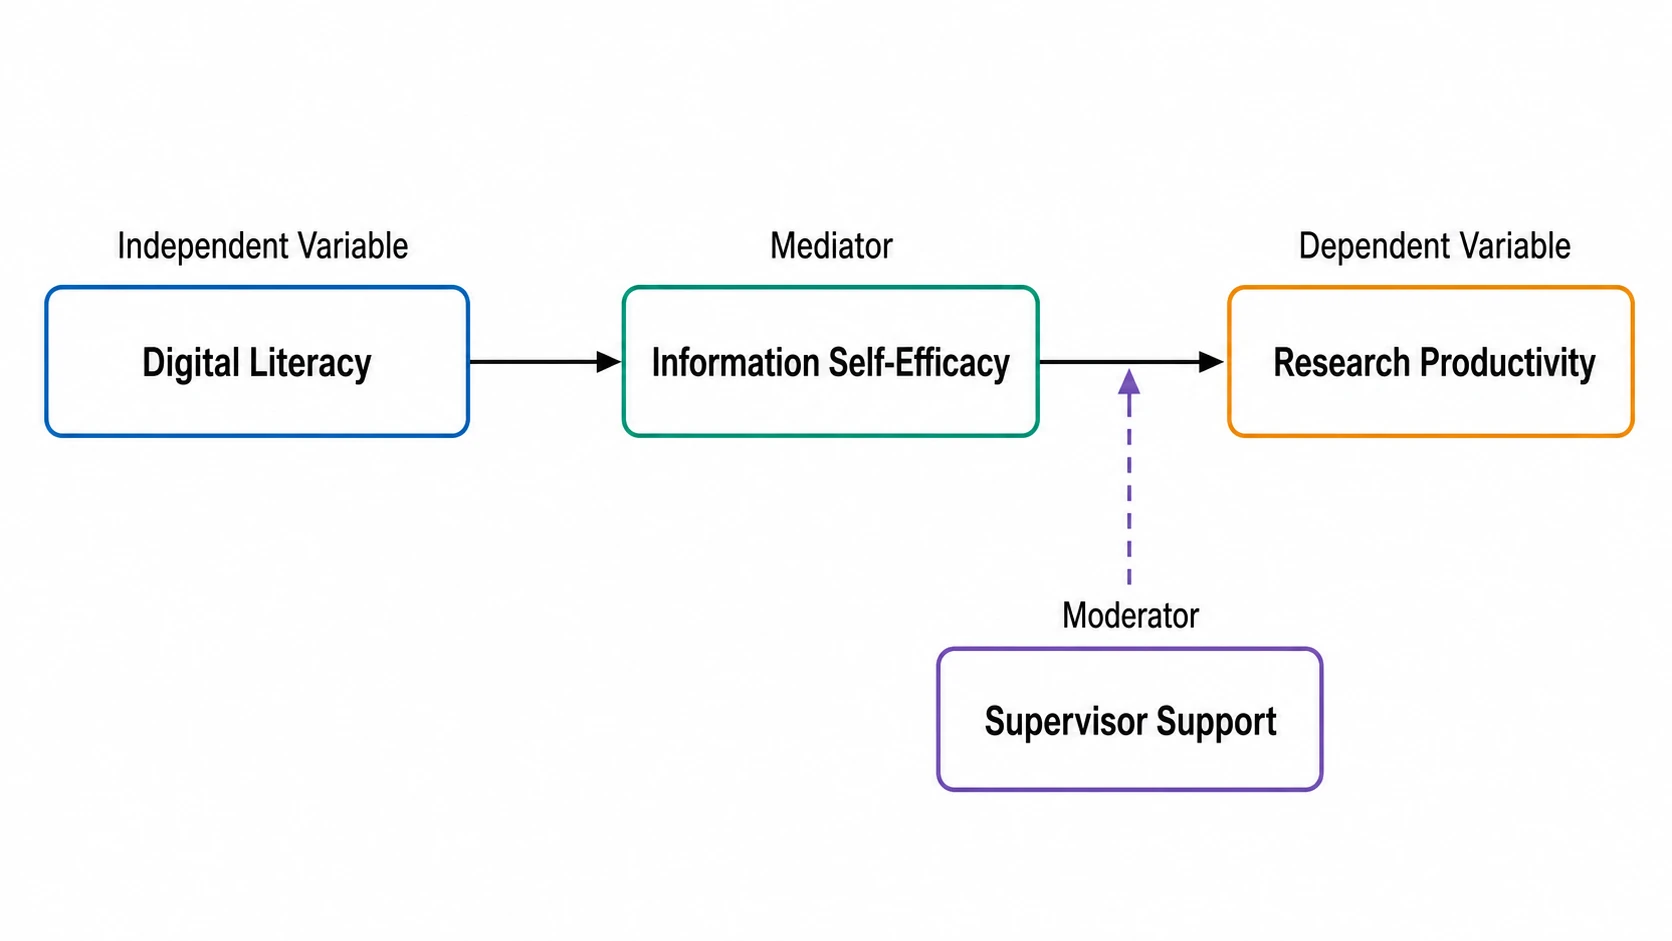
Conceptual Framework Generator
Turn variables, hypotheses, and relationships into a clear conceptual framework in research.
Research
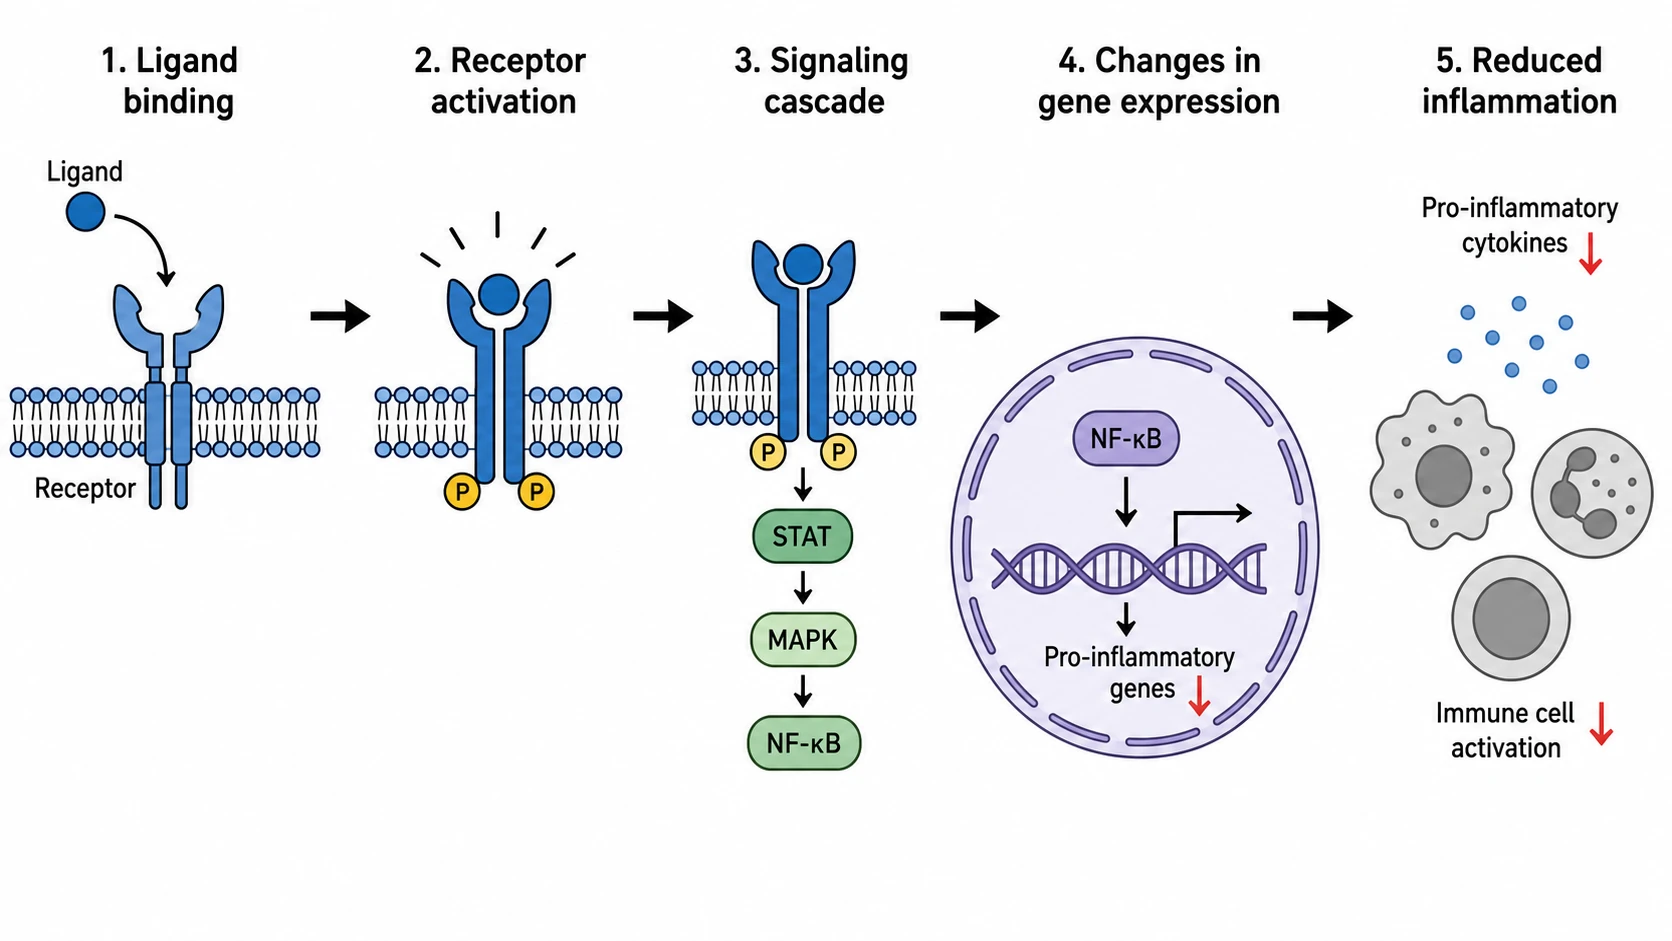
Graphical Abstract Maker
Turn your abstract into a clear, journal-ready graphical abstract.
Research
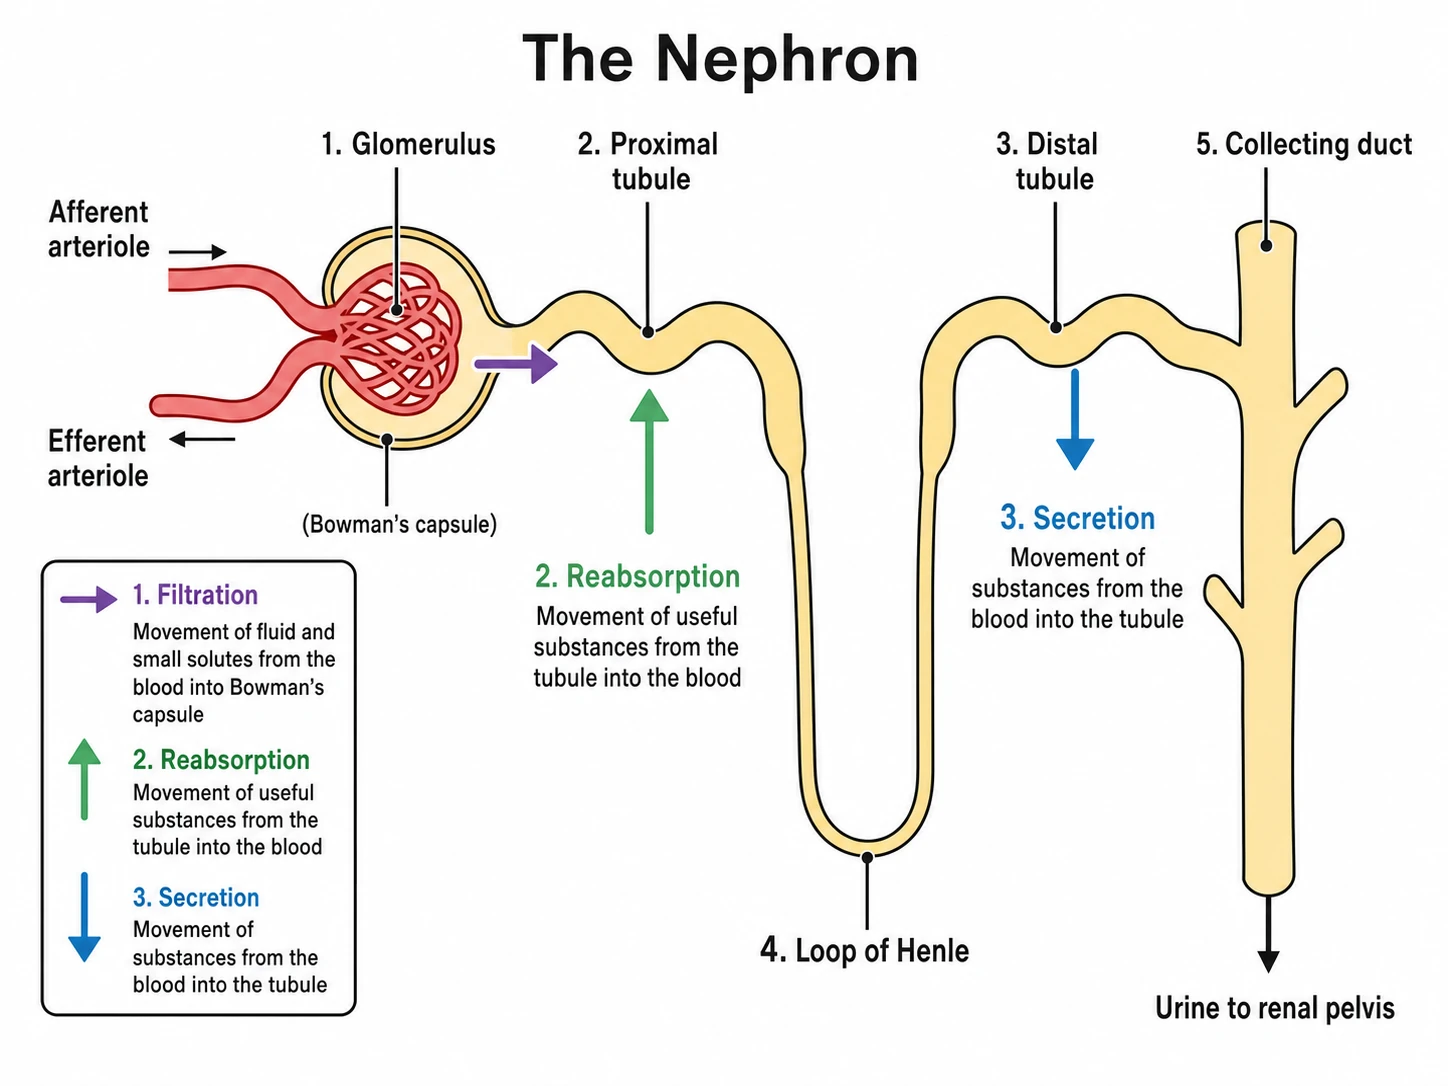
Scientific Illustration Generator
Turn a description into an accurate, labeled scientific illustration.
Research
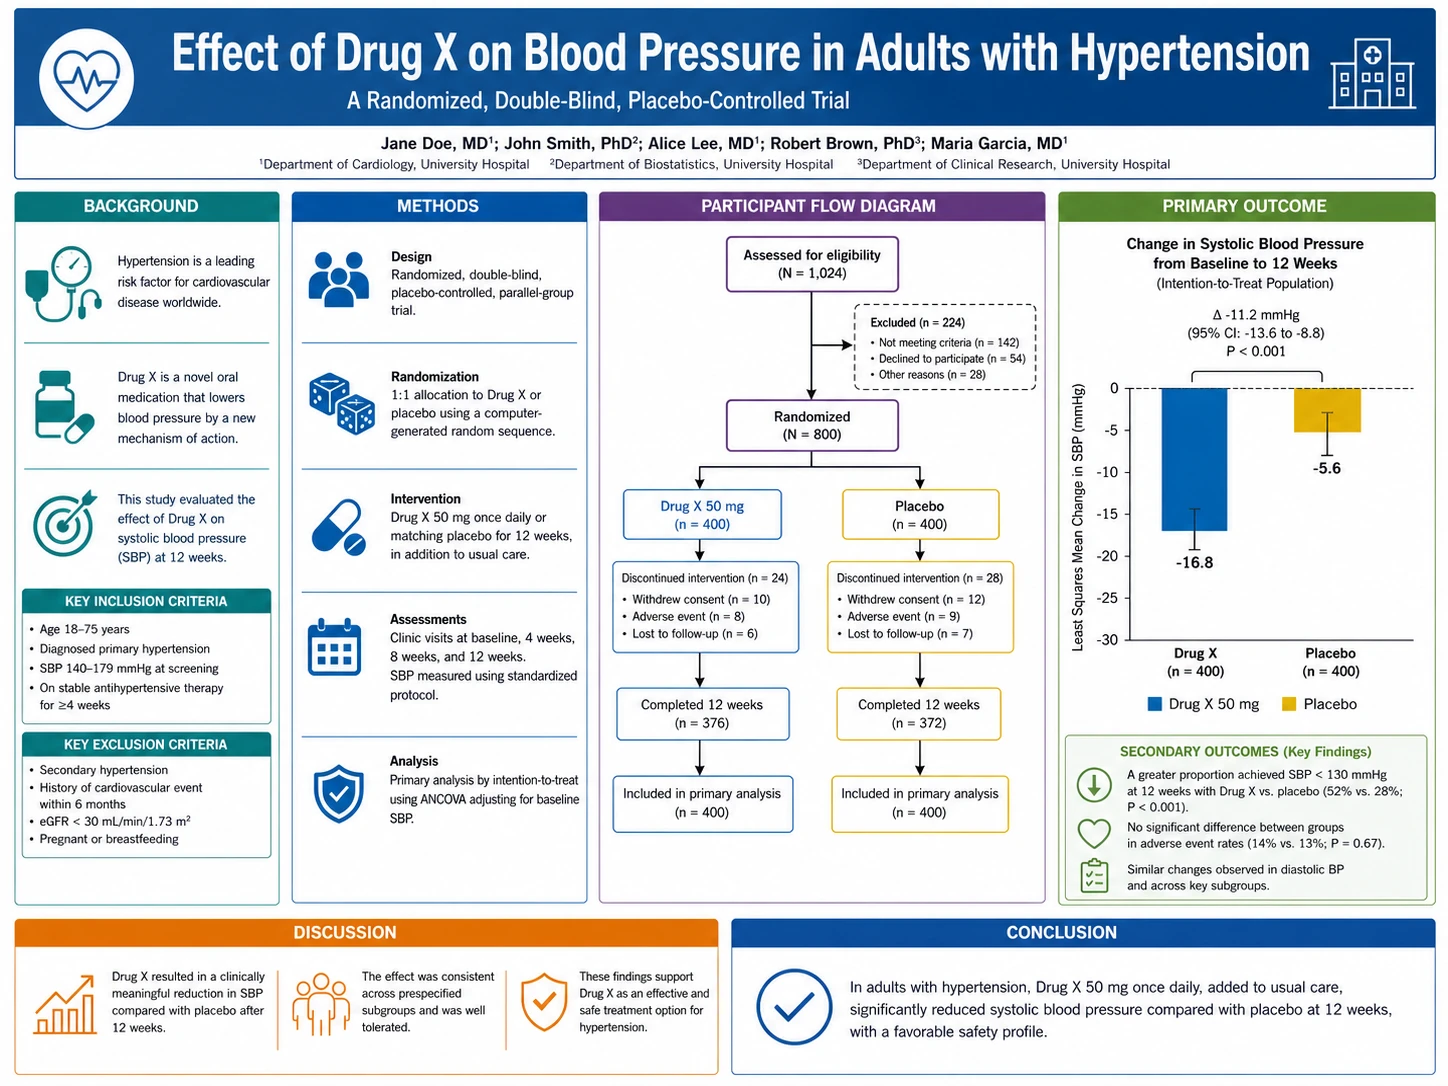
Scientific Poster Generator
Turn your study into a clean, conference-ready research poster.
Research
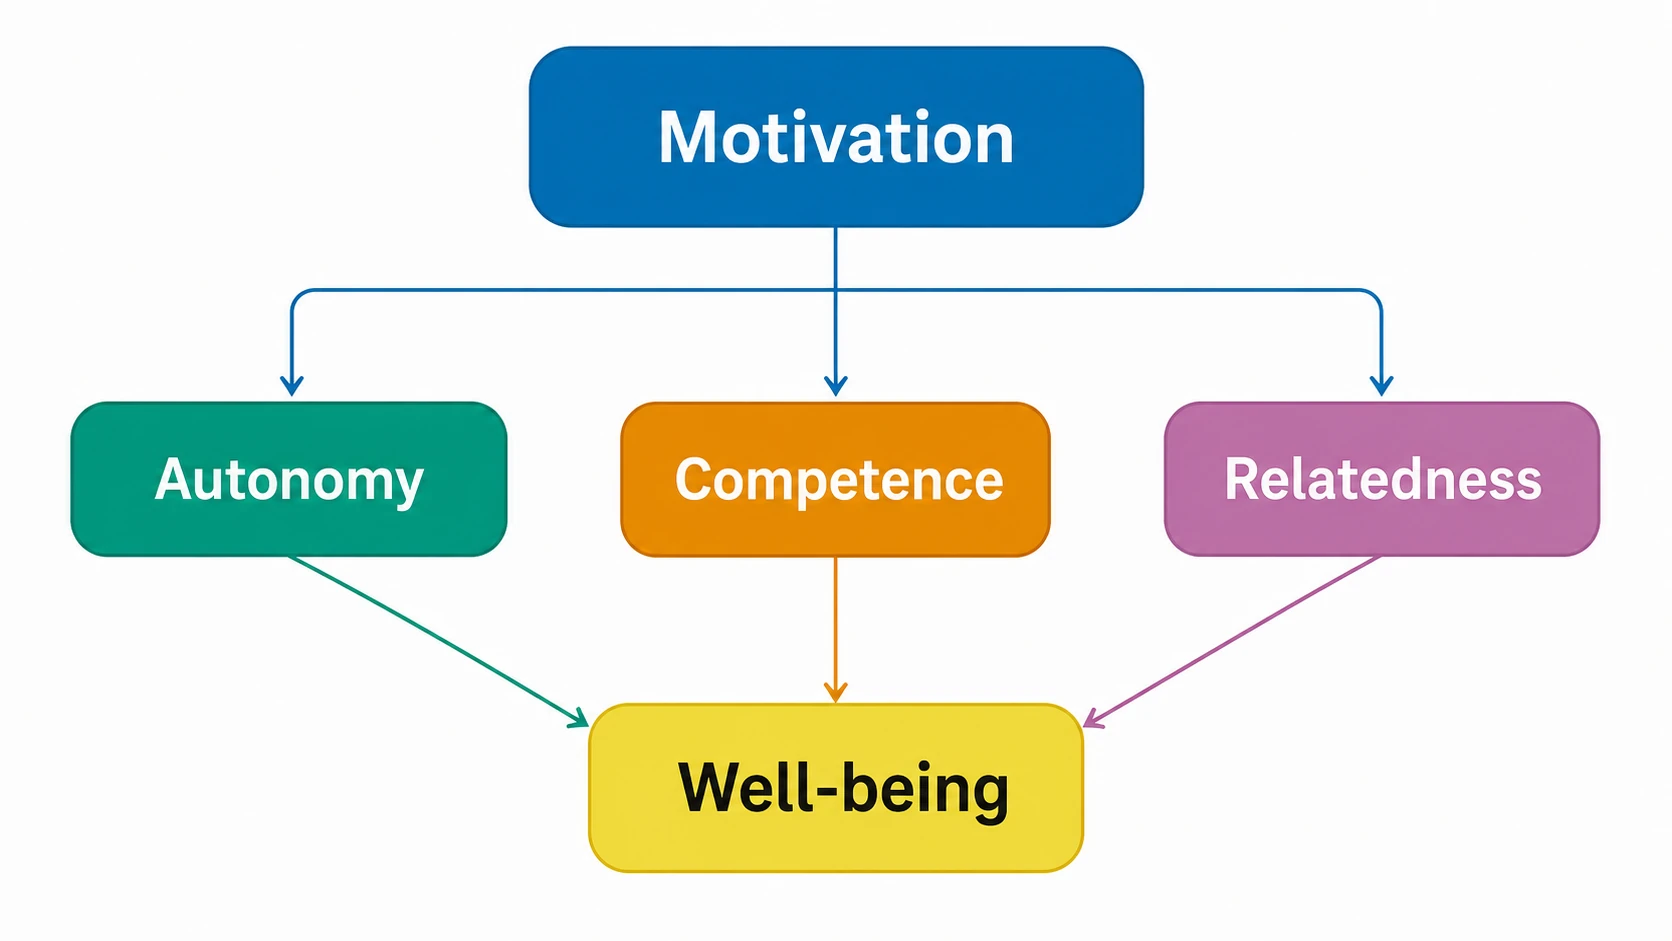
Theoretical Framework Generator
Turn the theory behind your study into a clear theoretical framework diagram.
Research
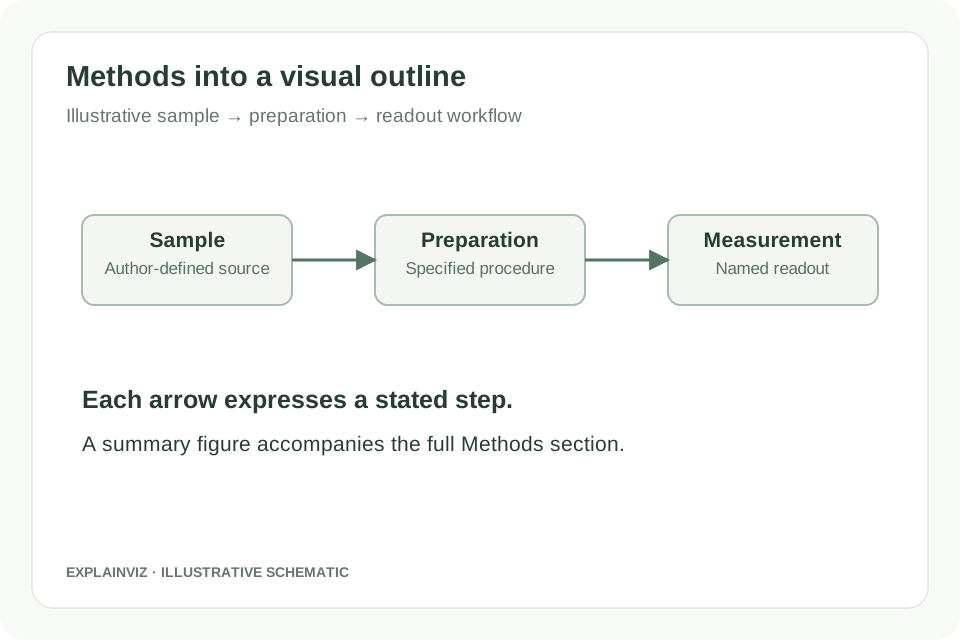
Experimental Procedure Schematic
Describe your experimental steps, groups and readouts. Draft a methods schematic, then check its labels and relationships against your study before using it in a paper.
Research
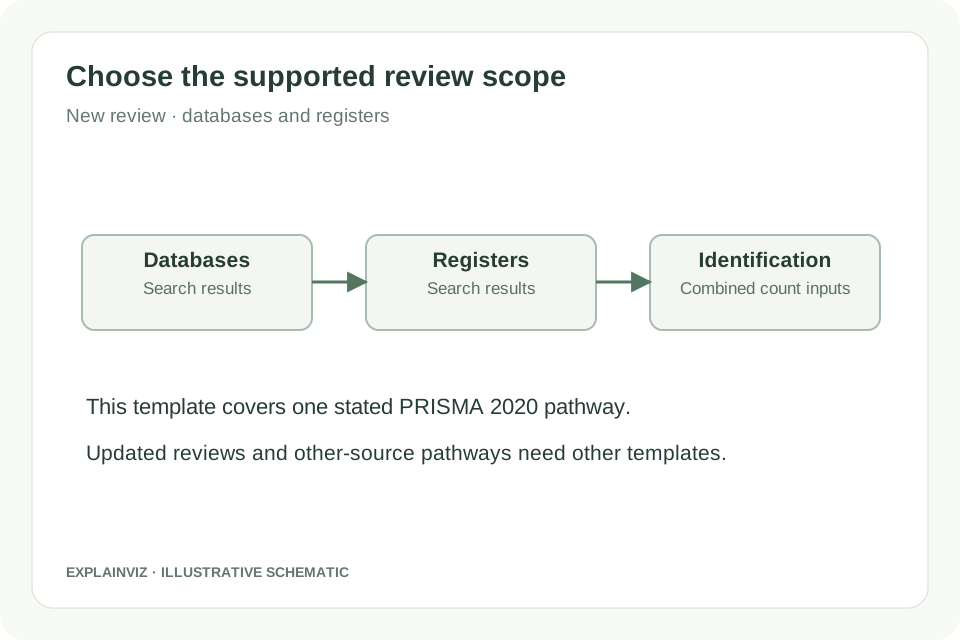
PRISMA Flow Diagram Generator
Enter your review’s screening counts, inspect the PRISMA 2020 pathway and download an editable SVG. This template covers new reviews using databases and registers.
Research
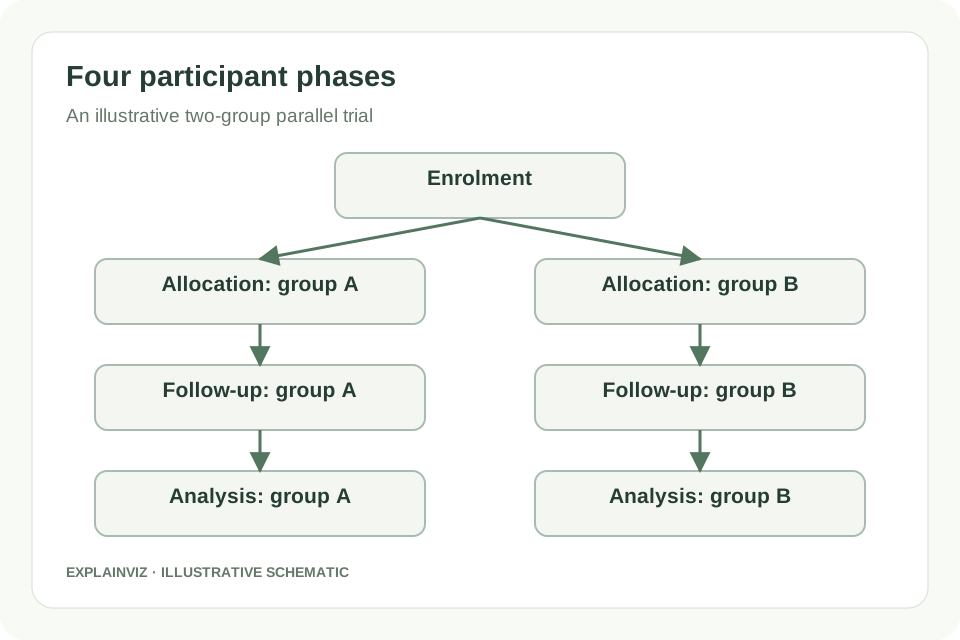
CONSORT Flow Diagram Generator
Enter two-group trial counts and reasons to build a CONSORT 2025 participant flow diagram. Review enrolment, allocation, follow-up and primary-outcome analysis, then download SVG.