Education
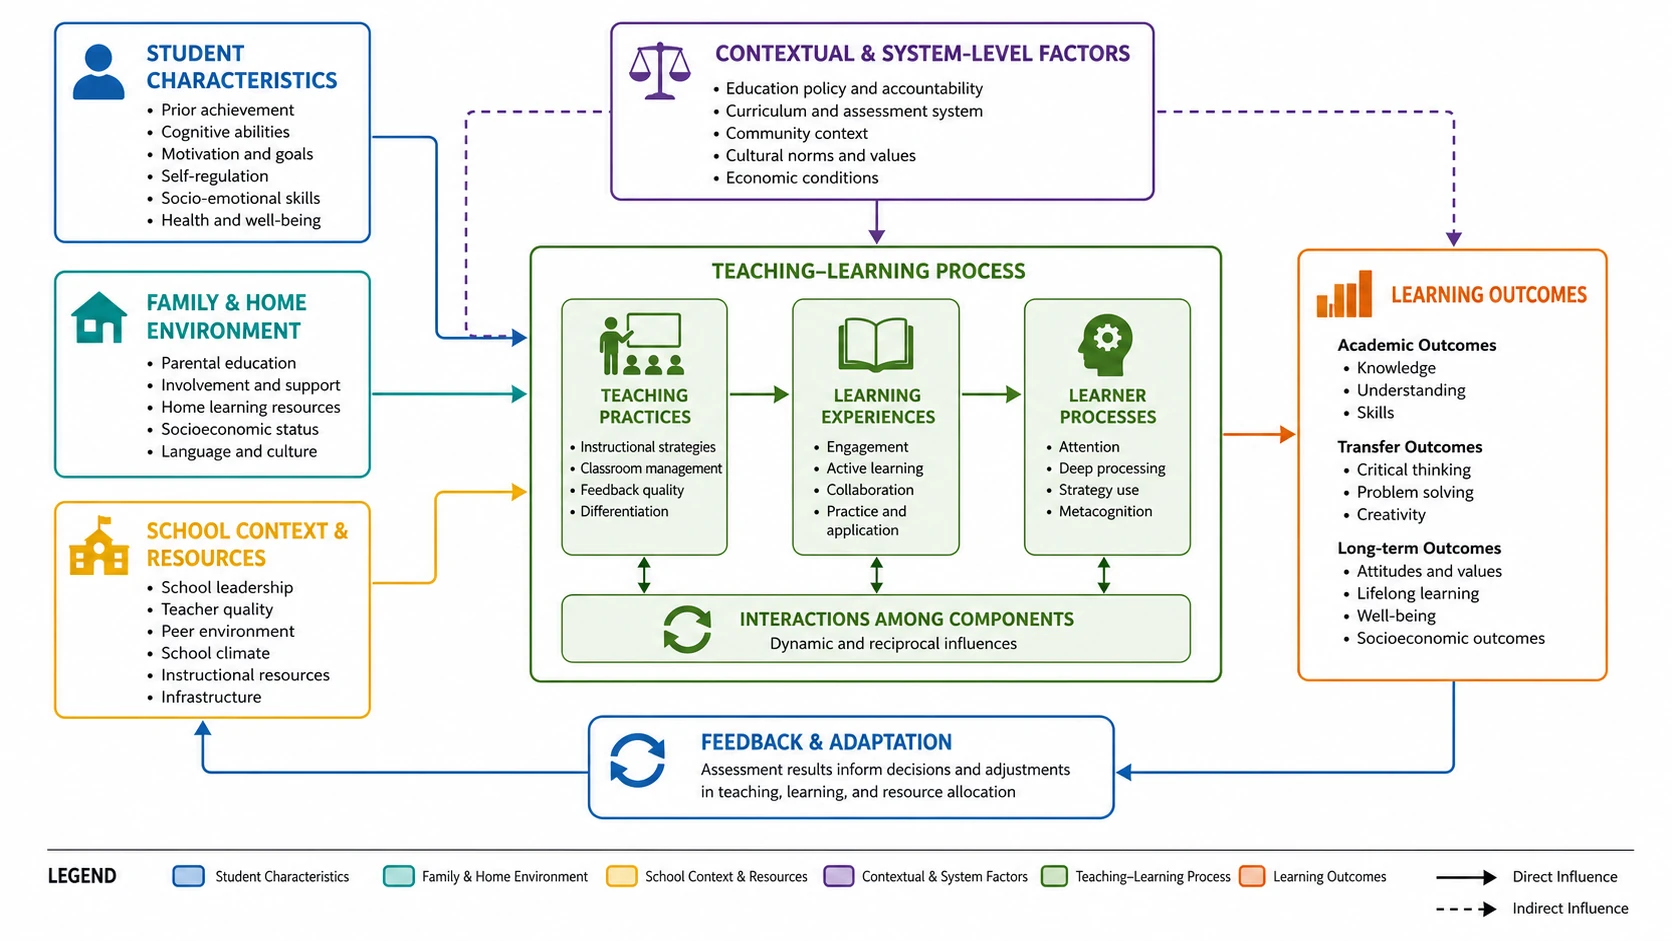
Education conceptual frameworkTeaching factors and learning outcomes
Research methodology tool
Turn your variables, hypotheses, and relationships into a clear conceptual framework diagram for your thesis or paper. Describe your study and the AI draws the boxes, arrows, and labels.
CV-2 Standard · 16:9
conceptual framework
Try an example
Explore examples with independent and dependent variables, mediators, moderators, and mixed-methods relationships.
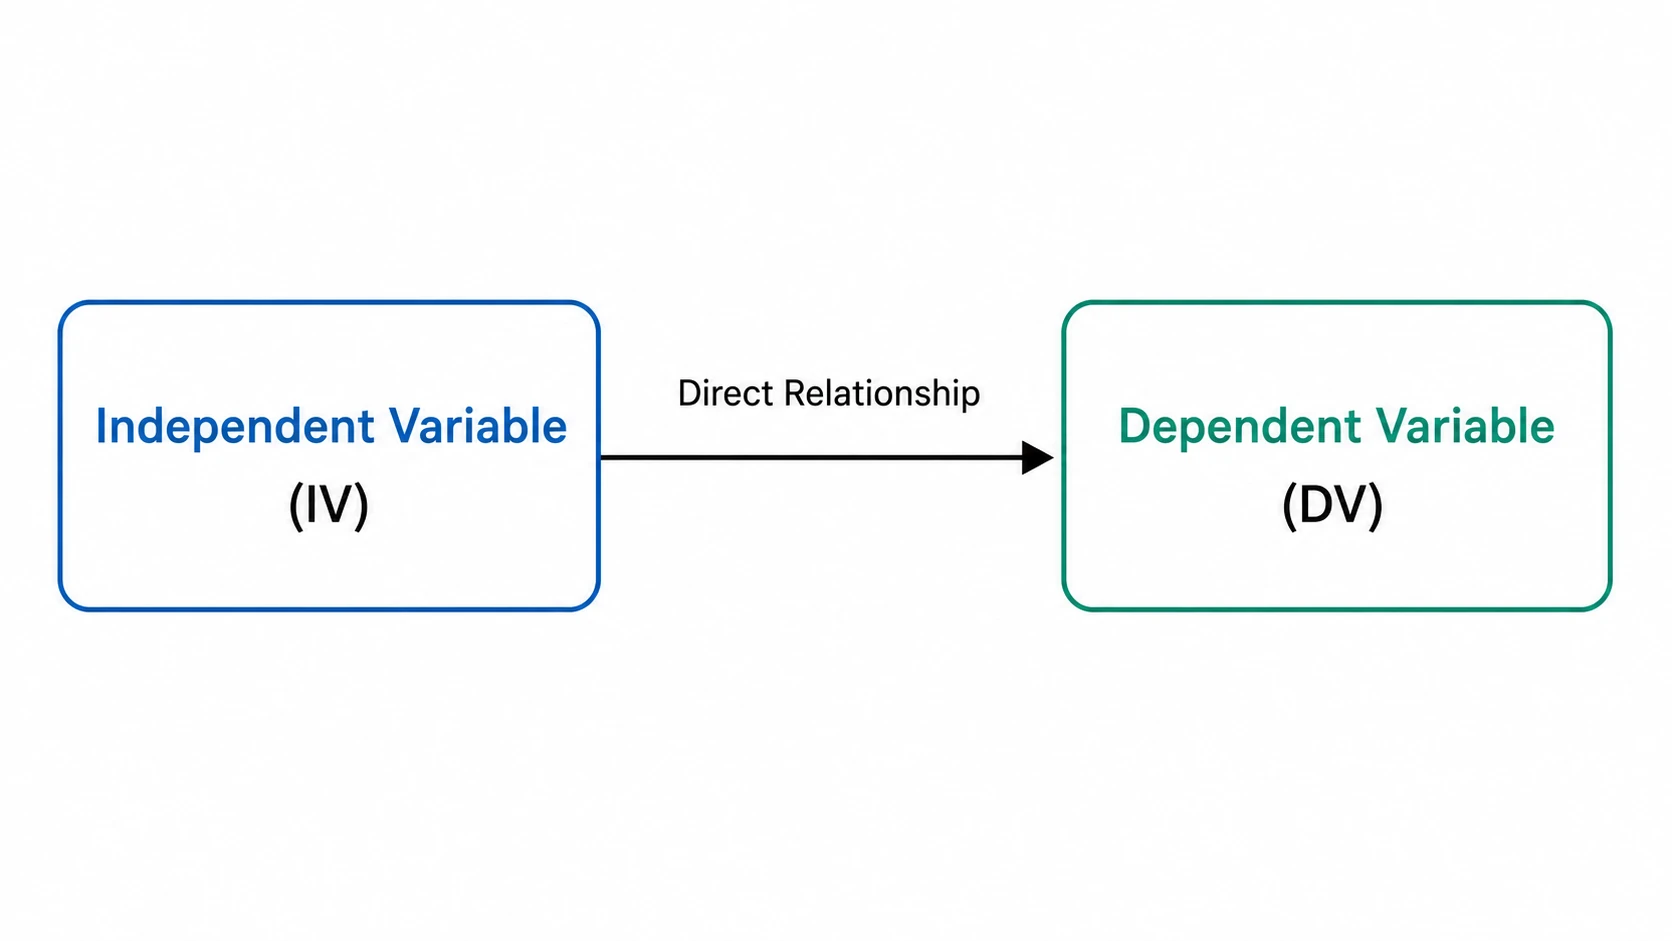
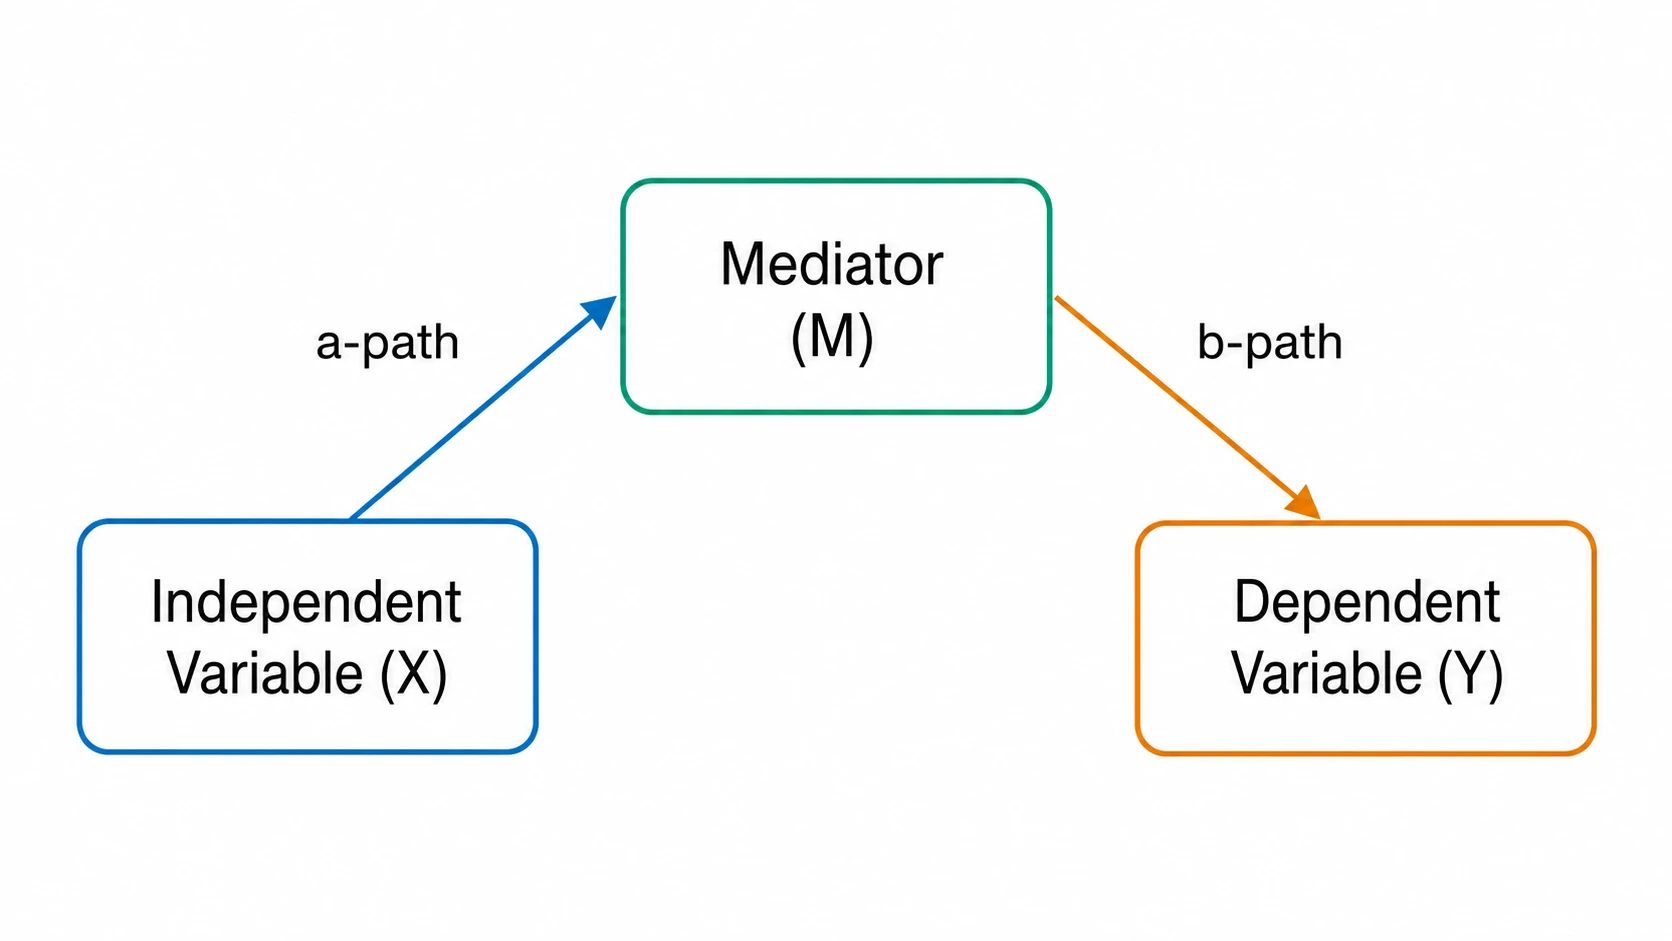
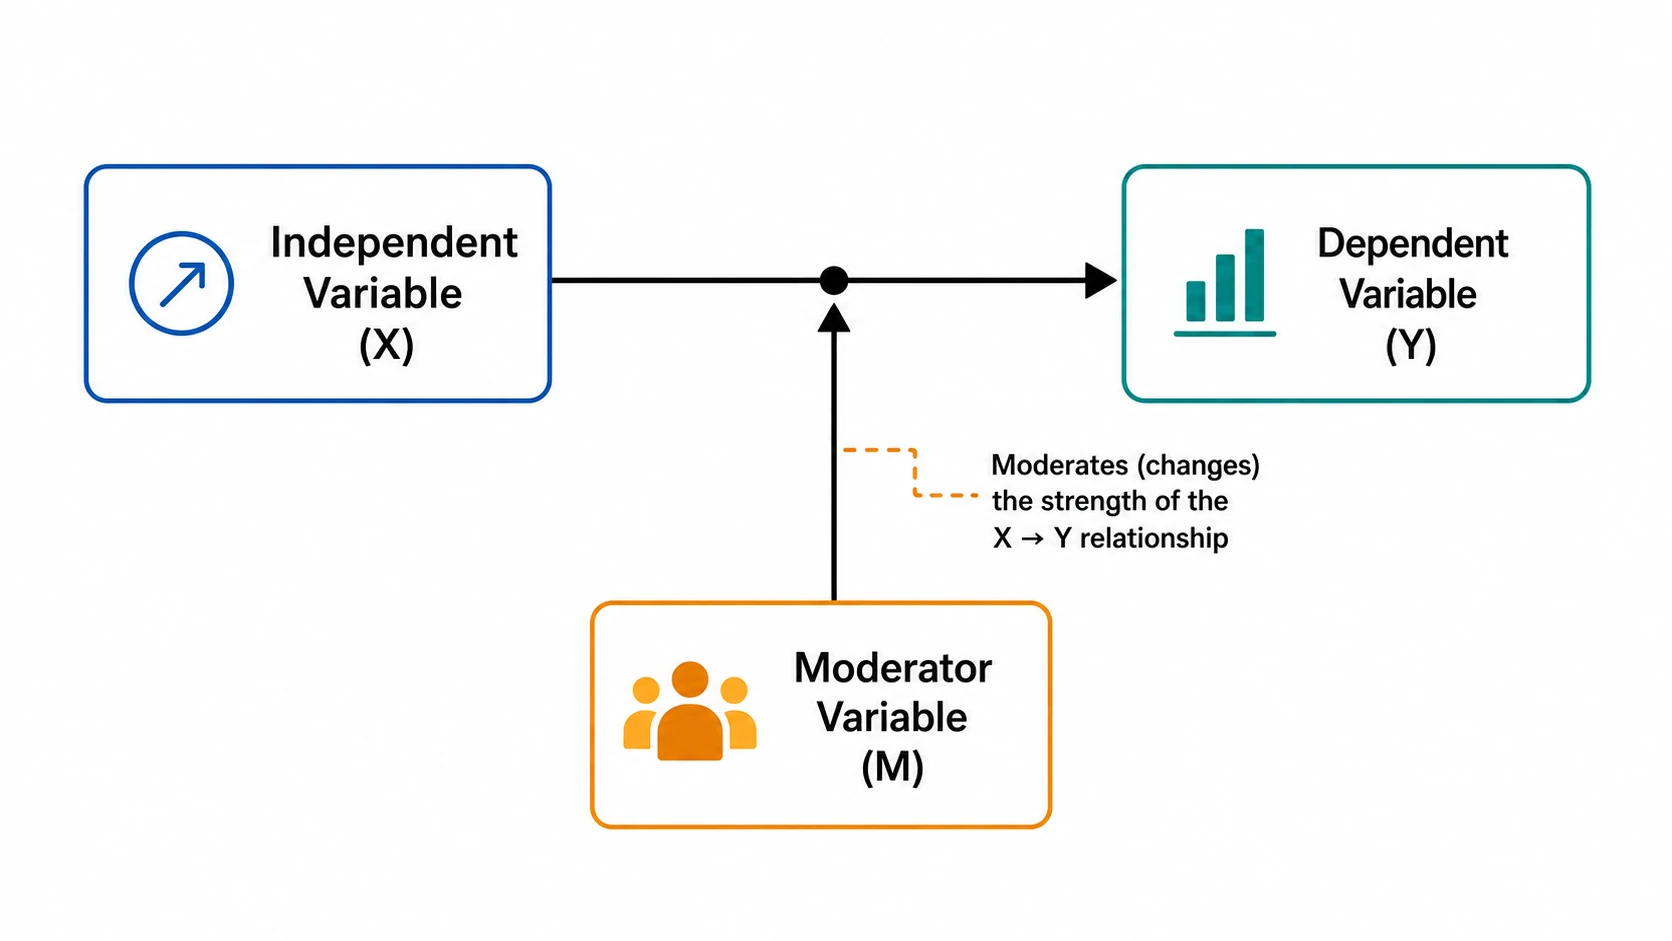
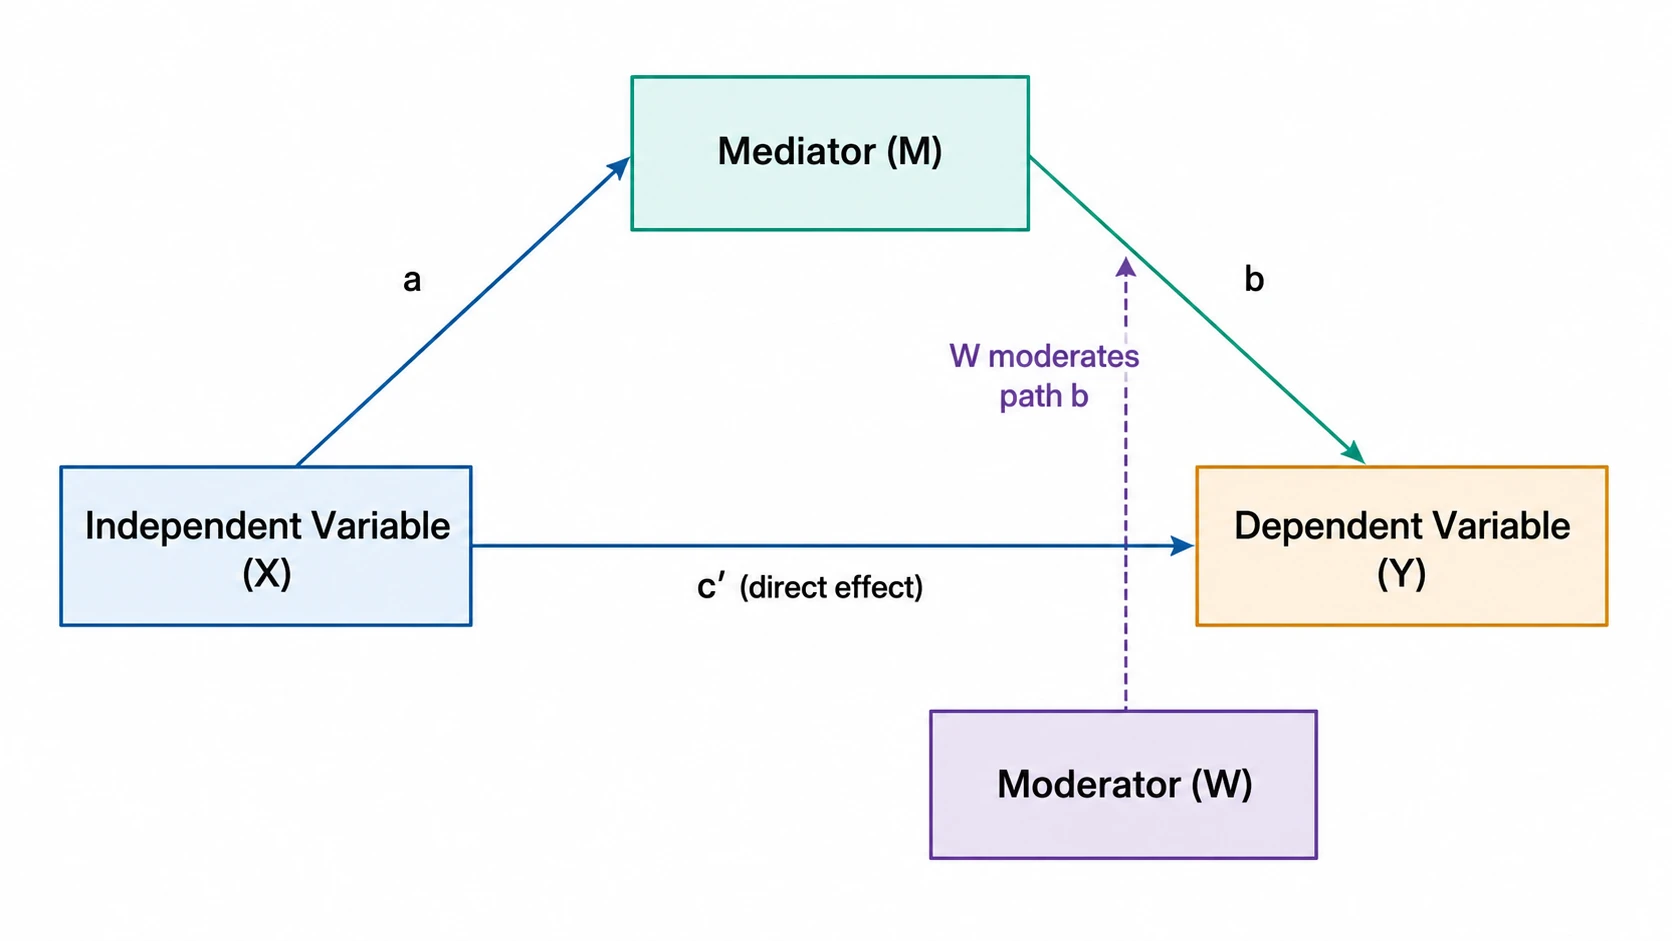
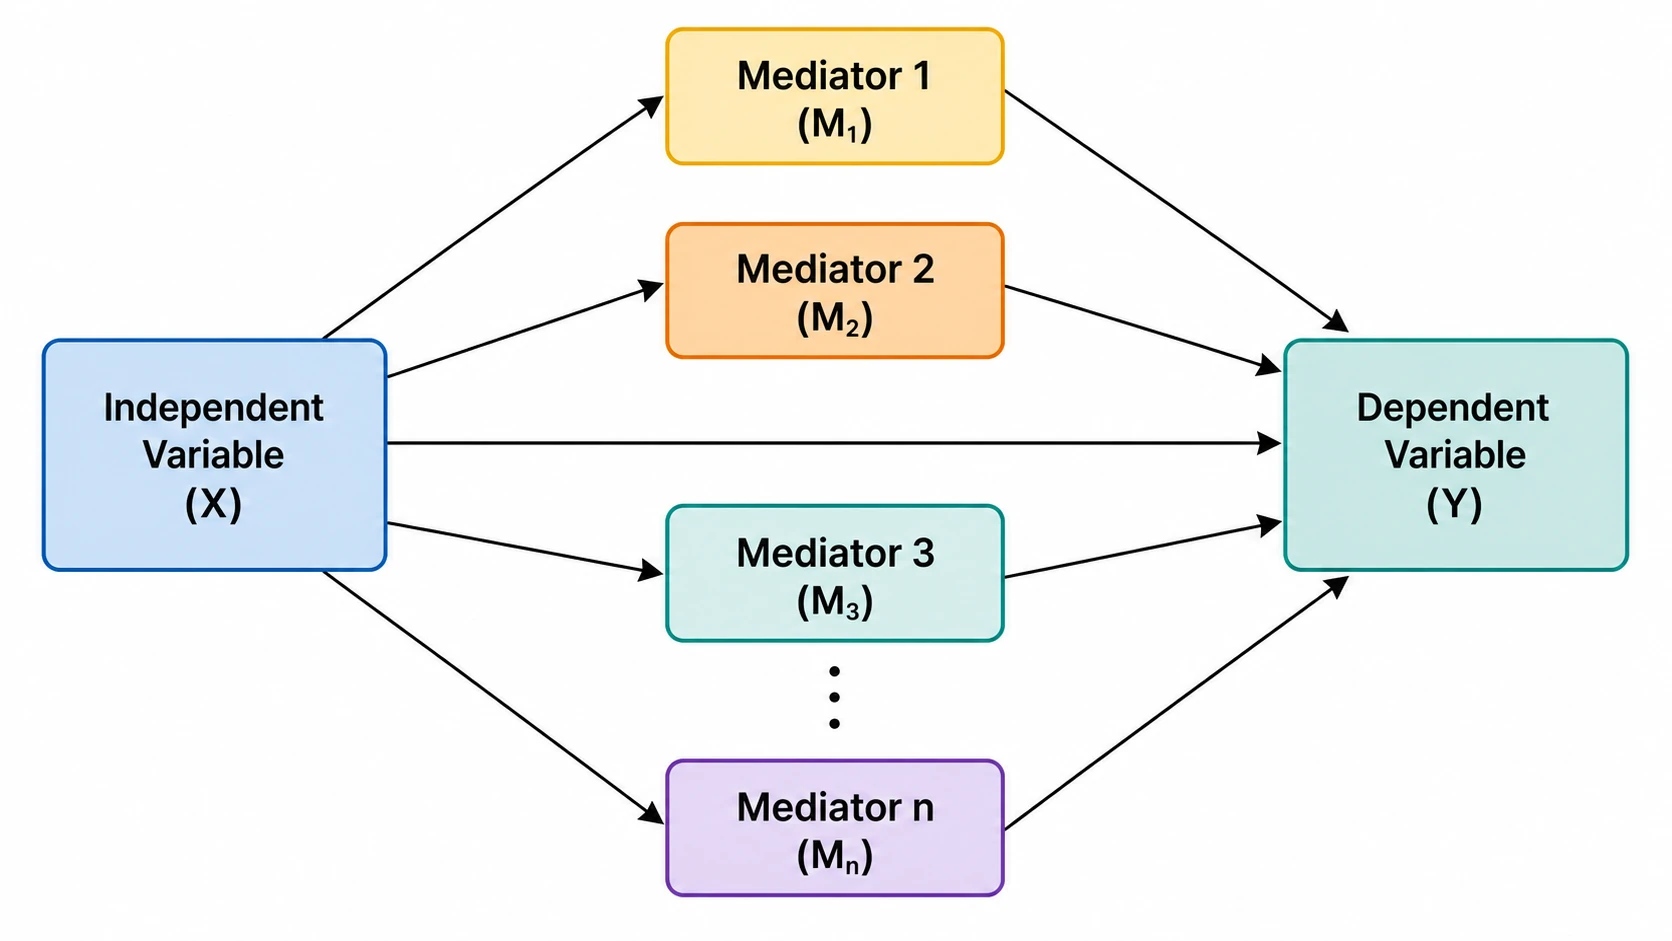
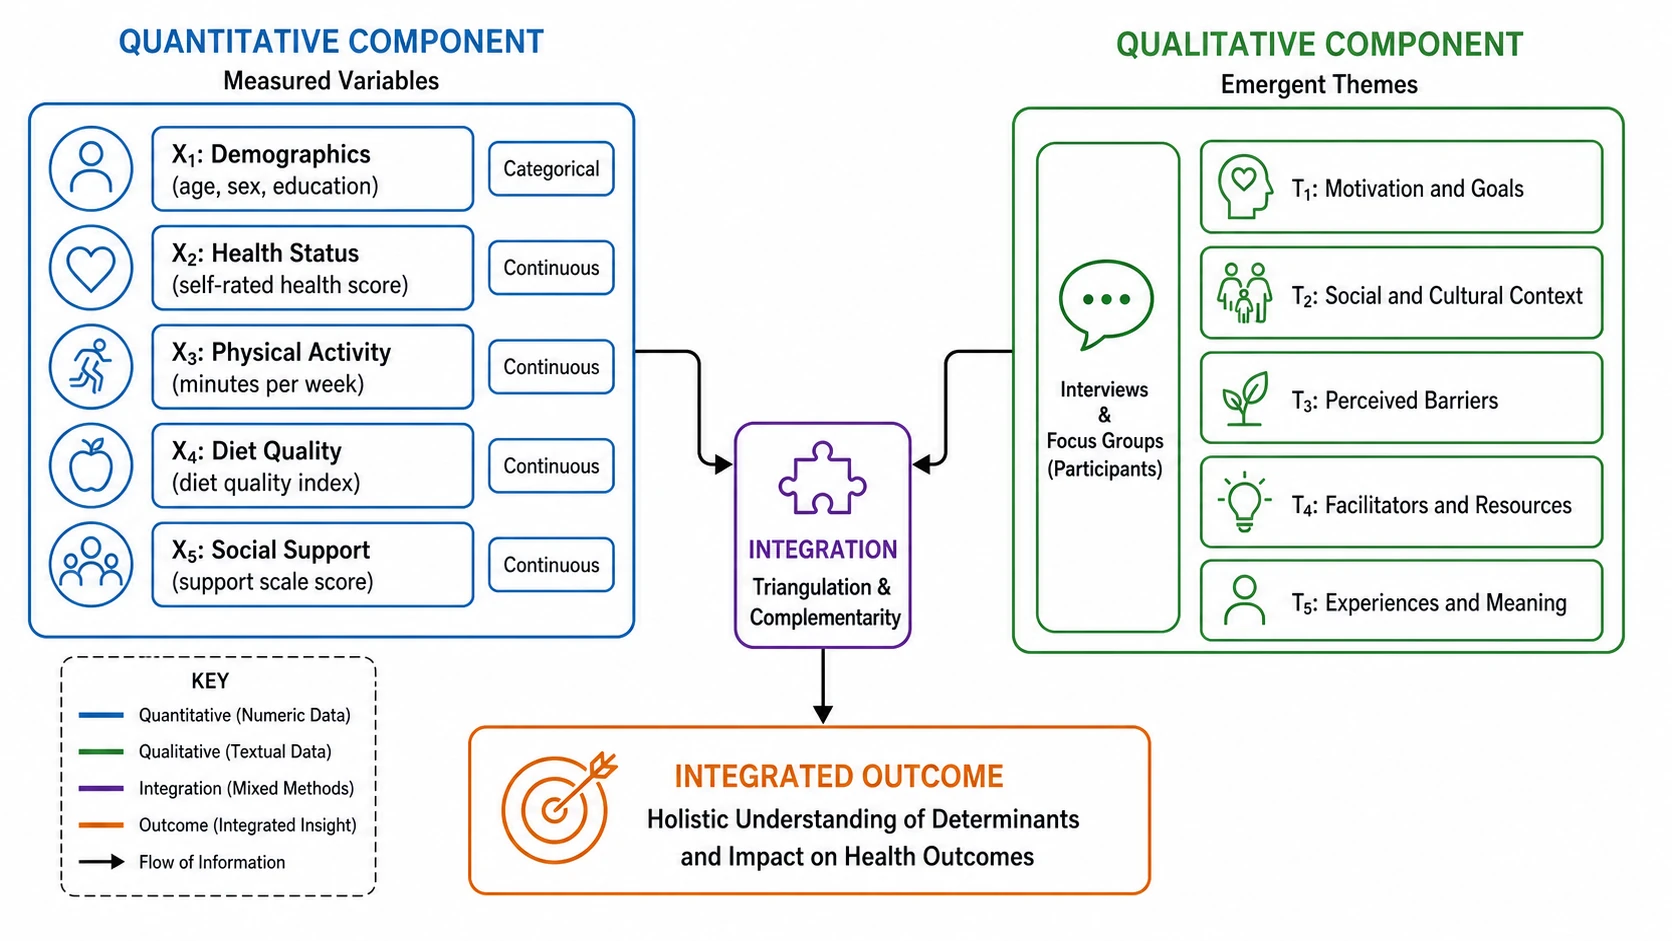
A conceptual framework is a diagram that maps the key variables in your study and shows how you expect them to relate. Unlike a literature review, which surveys existing knowledge, a conceptual framework visualizes your own research design: which variables you will measure, which relationships you will test, and what direction you hypothesize each effect to take. In quantitative research, the diagram typically shows independent variables, dependent variables, mediators, and moderators connected by directional arrows. A well-drawn conceptual framework keeps your methodology focused and helps reviewers, committee members, and readers understand your study at a glance.
A conceptual framework is not optional decoration — it is a required section in most thesis and dissertation formats. Your committee will evaluate whether the diagram accurately reflects your hypotheses, whether each arrow is supported by literature, and whether the variables are operationalized correctly. A clear framework also prevents scope creep: once you commit the relationships to a diagram, you have a concrete map for your methodology chapter. Students who skip this step or draw it hastily often discover gaps in their research design during data collection, when fixing them is far more expensive.
The manual approach: open a drawing tool, create boxes for each variable, draw arrows by hand, align everything by eye, and redo the entire diagram when your advisor adds a mediating variable. With the conceptual framework generator: describe your variables and hypotheses in plain language, get a clean diagram with labeled boxes and directional arrows, edit any node or relationship, export as editable SVG, and revise whenever your design evolves — without starting from scratch.
Start by listing your independent variables — the factors you believe cause a change. Then identify your dependent variables — the outcomes you will measure. Next, consider whether any mediating variables sit between cause and effect, and whether any moderating variables change the strength or direction of a relationship. Once you have the list, the generator arranges them into a structured diagram with labeled arrows. A strong conceptual framework reads from left to right: independent variables on the left, mediators in the middle, and dependent variables on the right, with moderators branching in from above or below.
A conceptual framework looks different depending on your methodology. In experimental research, the diagram emphasizes the treatment variable, control conditions, and measured outcomes. In correlational studies, it shows bidirectional or unidirectional relationships between observed variables. In mixed-methods research, the framework may include both quantitative paths and qualitative themes, often connected at a point of integration. The generator supports all these patterns — describe your design and the tool produces a layout that matches your methodology.
The most frequent mistake is including too many variables. A conceptual framework should focus on the variables you actually test, not everything mentioned in your literature review. Another common error is using vague labels like 'factors' or 'outcomes' instead of specific, operationalized variable names. Third, many students draw arrows without specifying direction or sign, leaving the relationships ambiguous. The generator encourages specificity: you name each variable and describe each expected relationship, and the tool produces a diagram with clear directional arrows.
Variables, arrows, mediators, and moderators are arranged for research communication, not decoration. The layout follows conventions that thesis committees and journal reviewers expect: independent variables grouped on the left, dependent variables on the right, mediators centered on the path, and moderators intersecting the relevant arrow. Export the conceptual framework as an editable vector SVG that opens in Illustrator, Inkscape, or Figma, ready to paste into your thesis or manuscript.
Teaching factors and learning outcomes
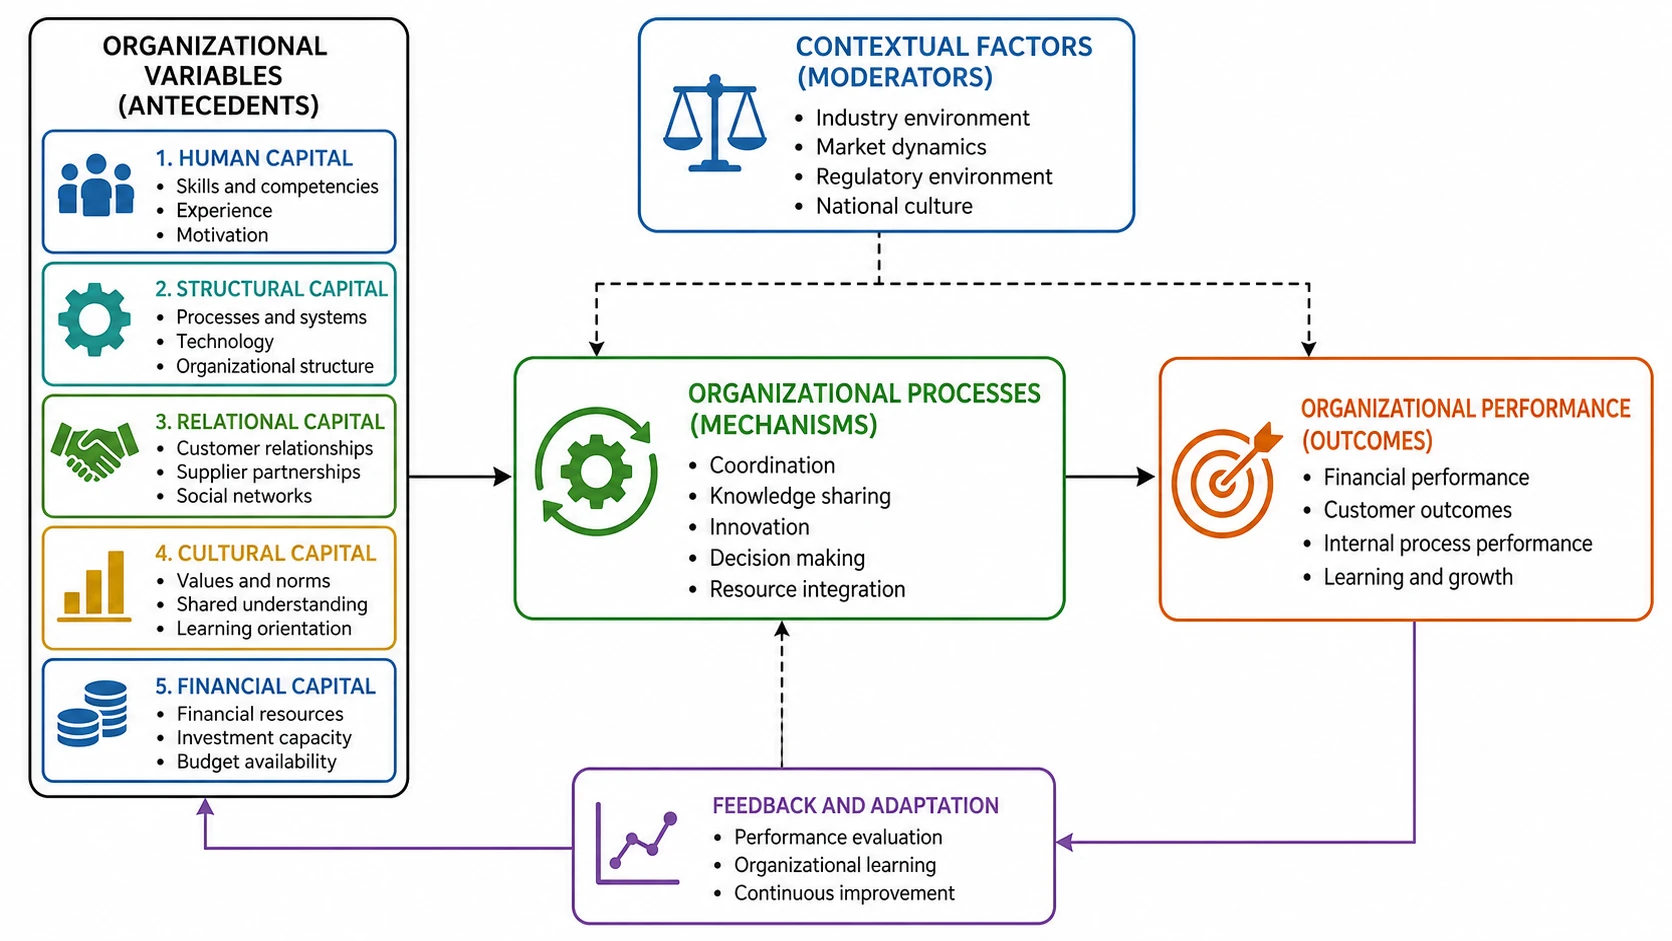
Organizational factors and performance
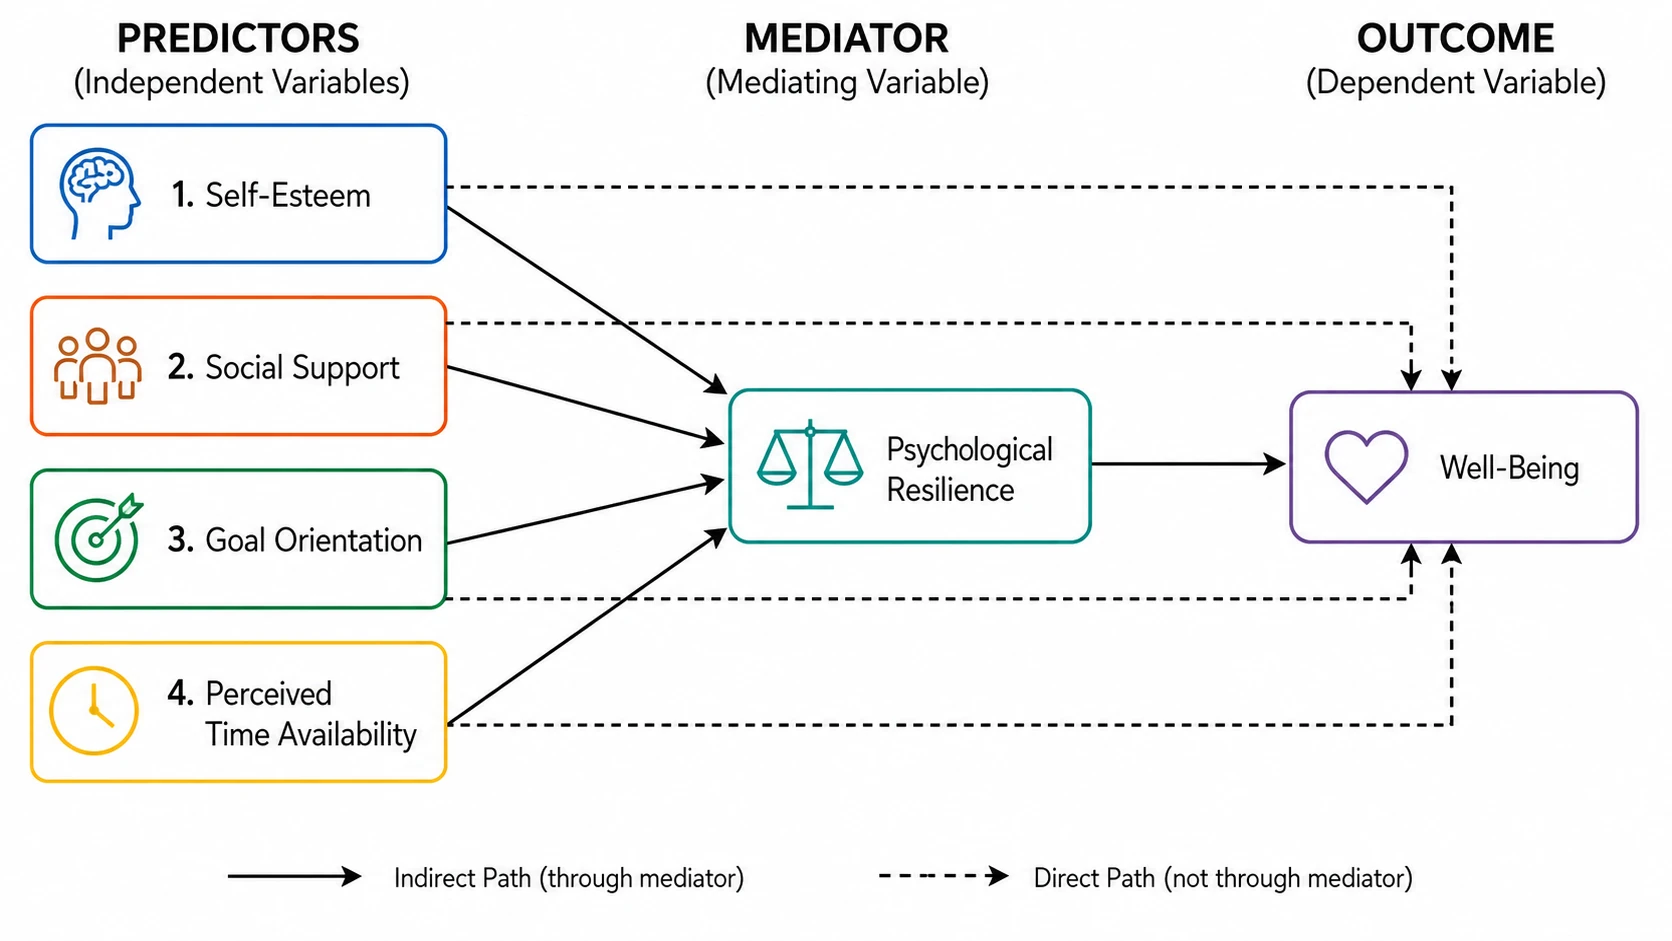
Psychological constructs and behavior
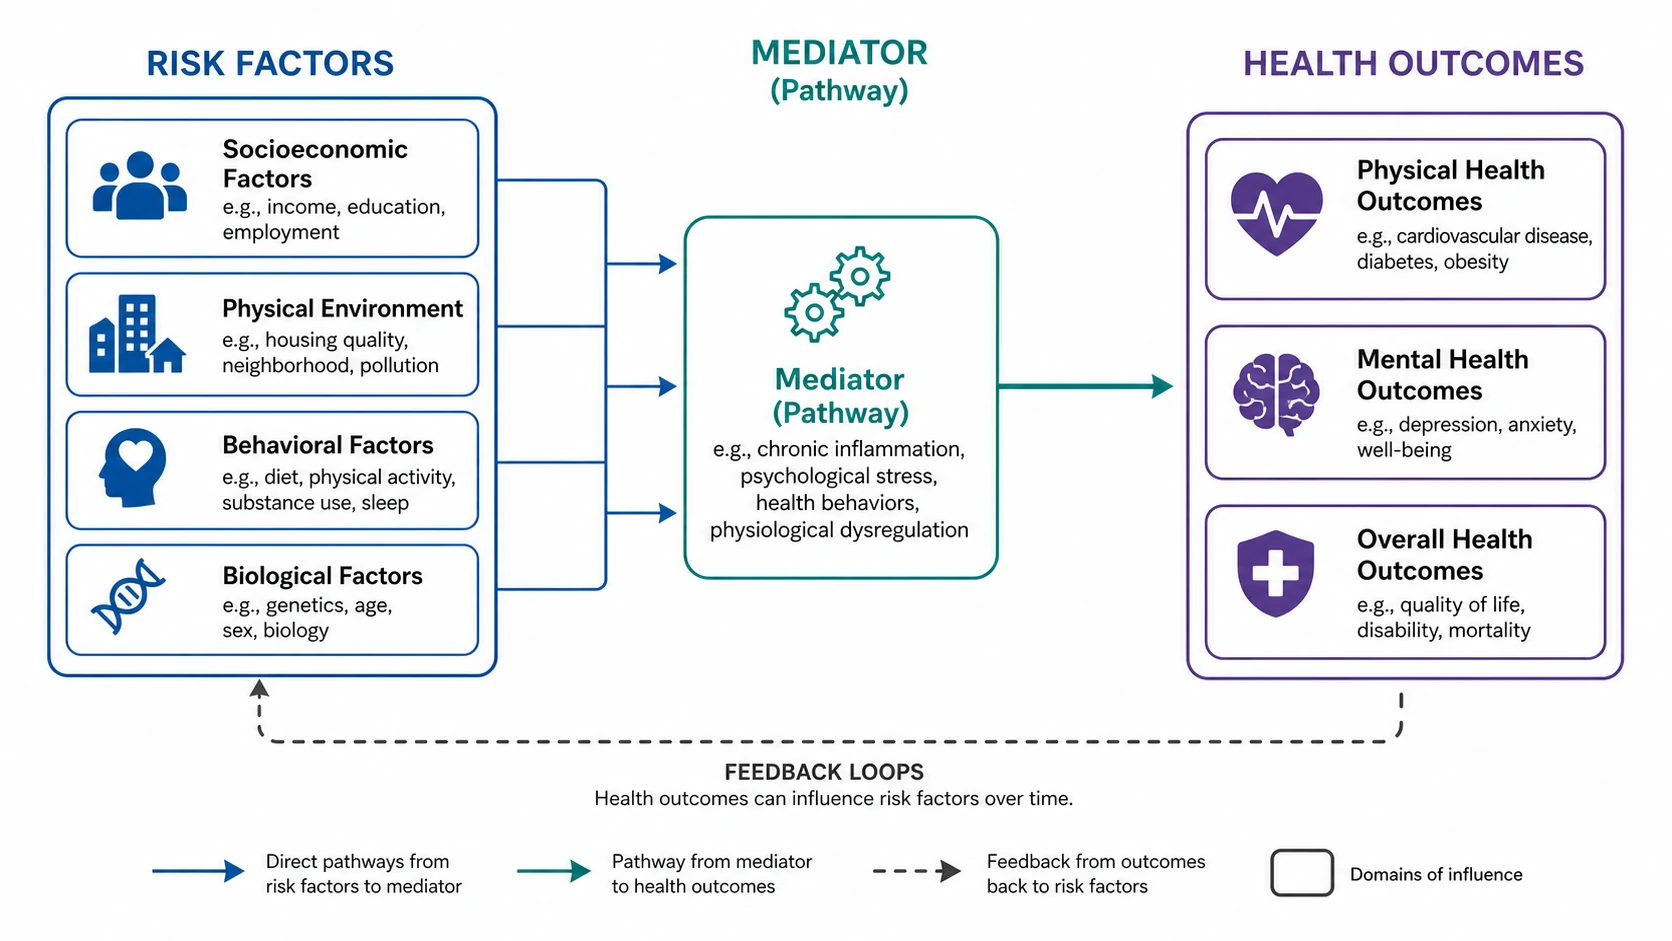
Health determinants and outcomes
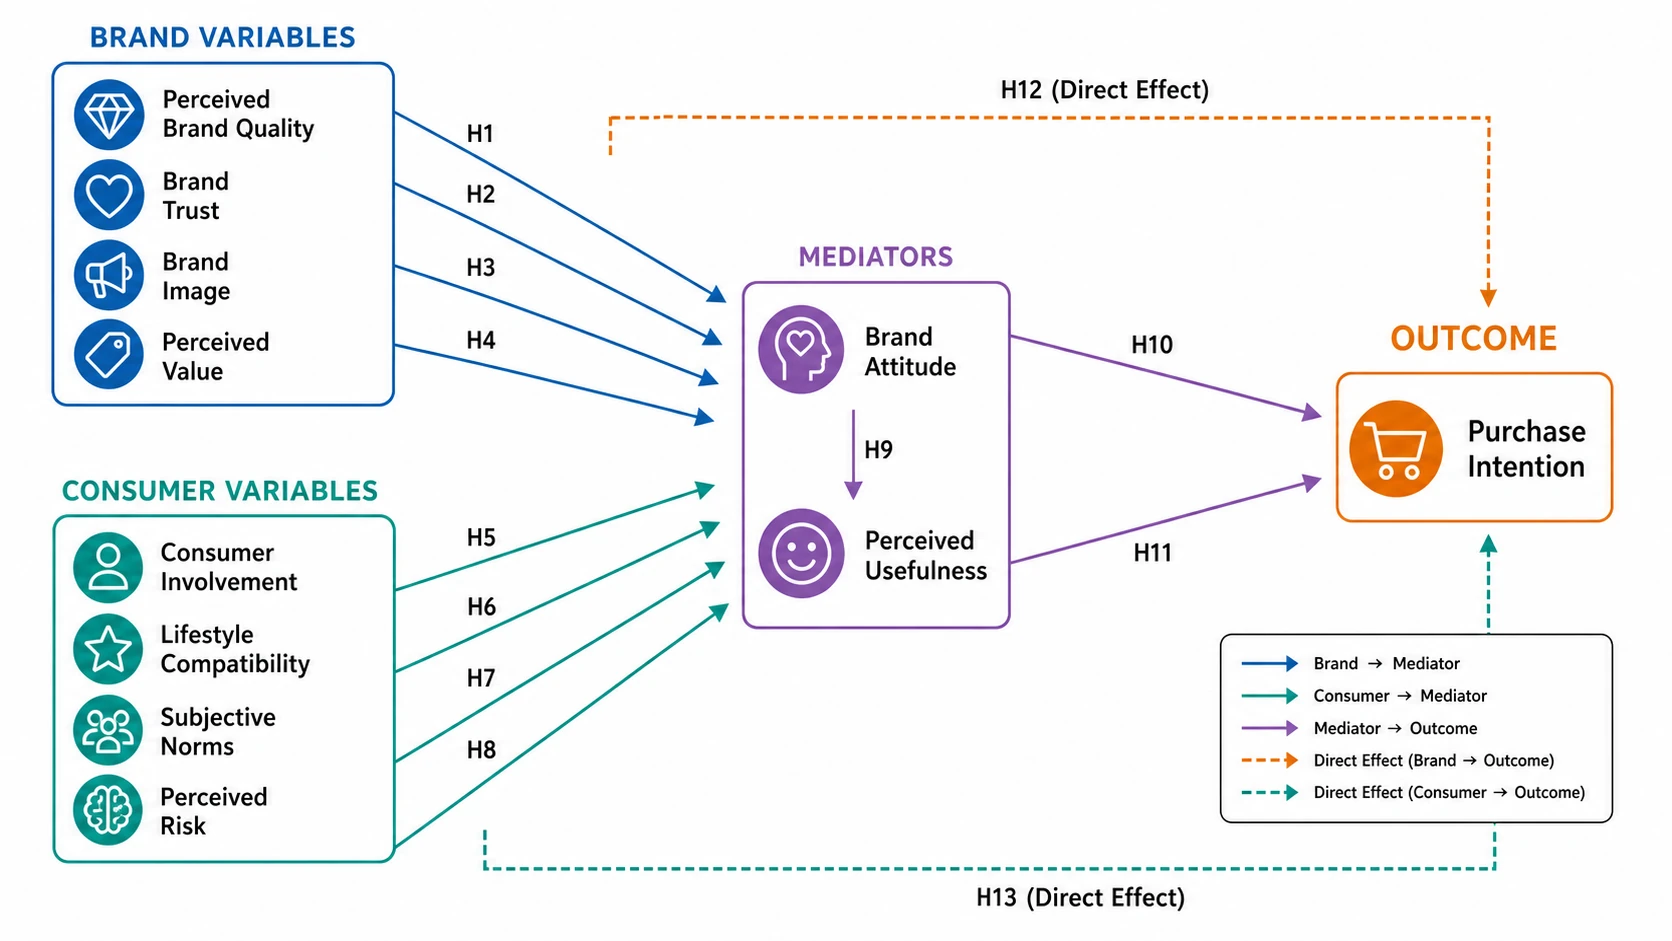
Consumer factors and purchase intention
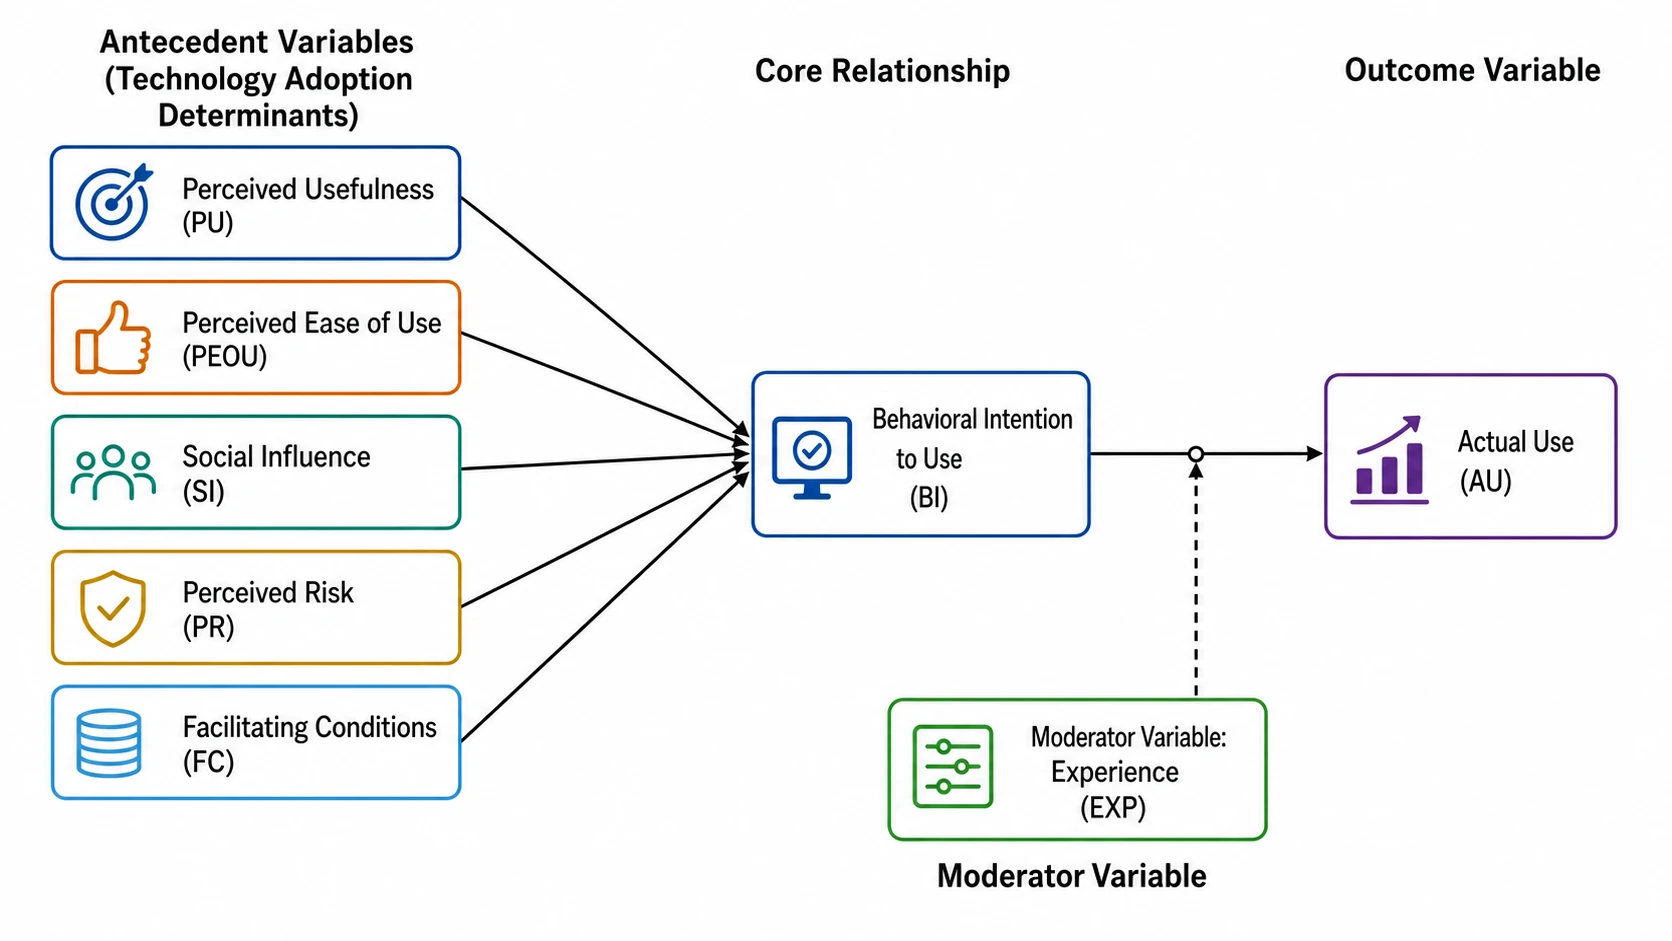
Technology characteristics and use
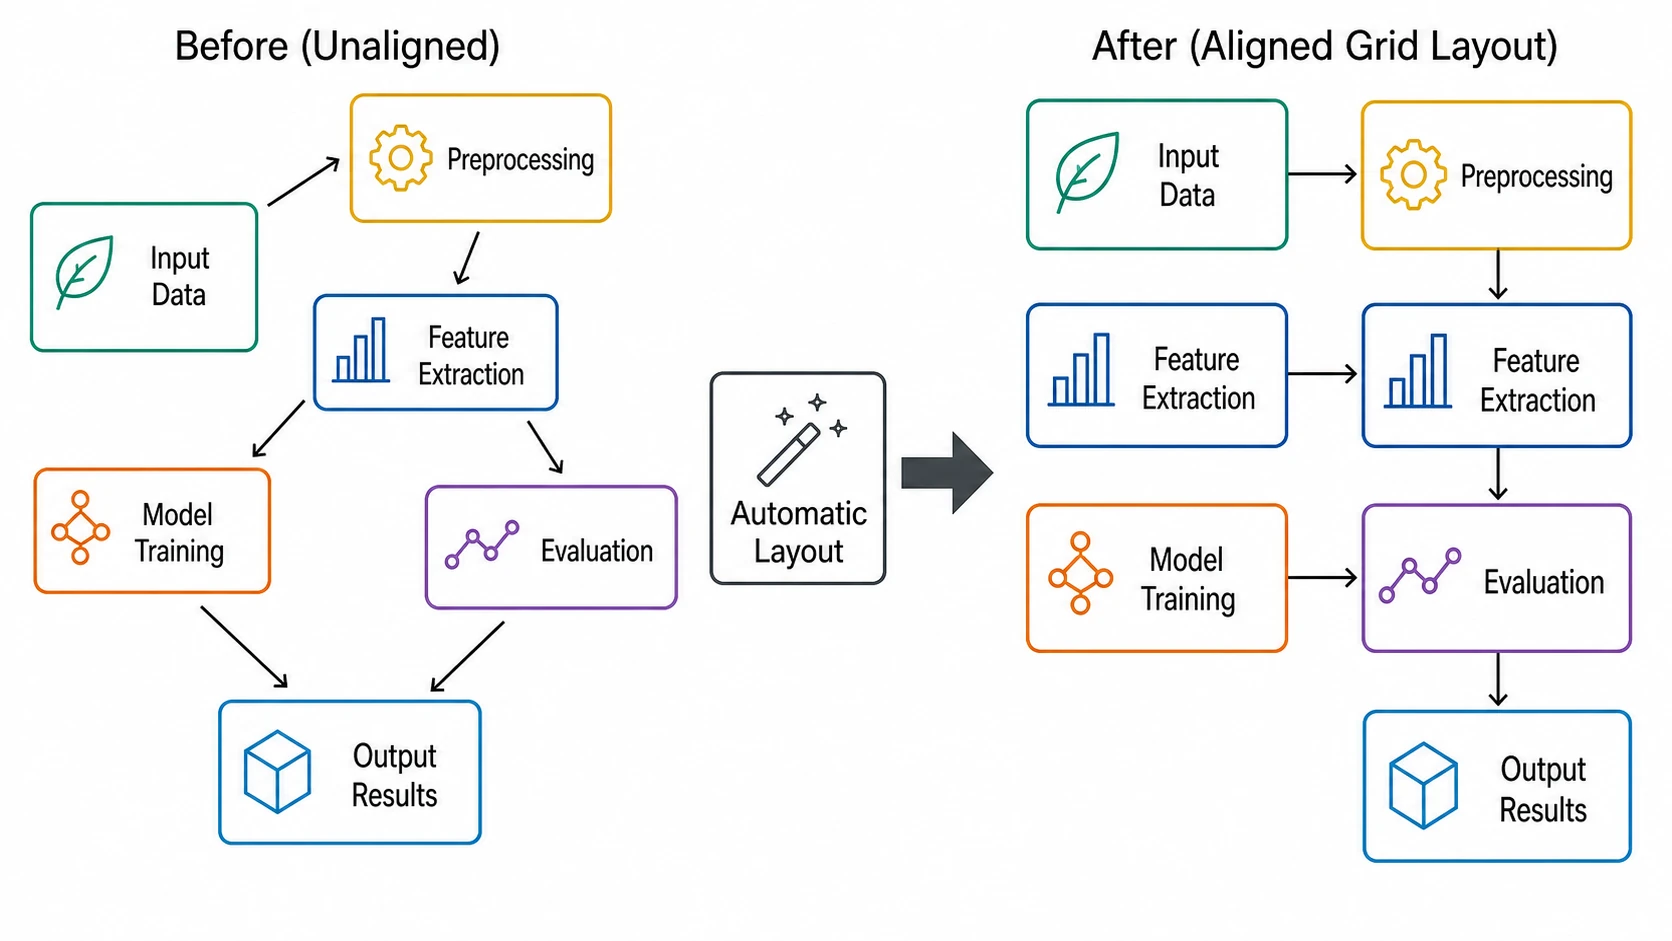
Arrange variable nodes, directional arrows, and the overall reading order automatically.
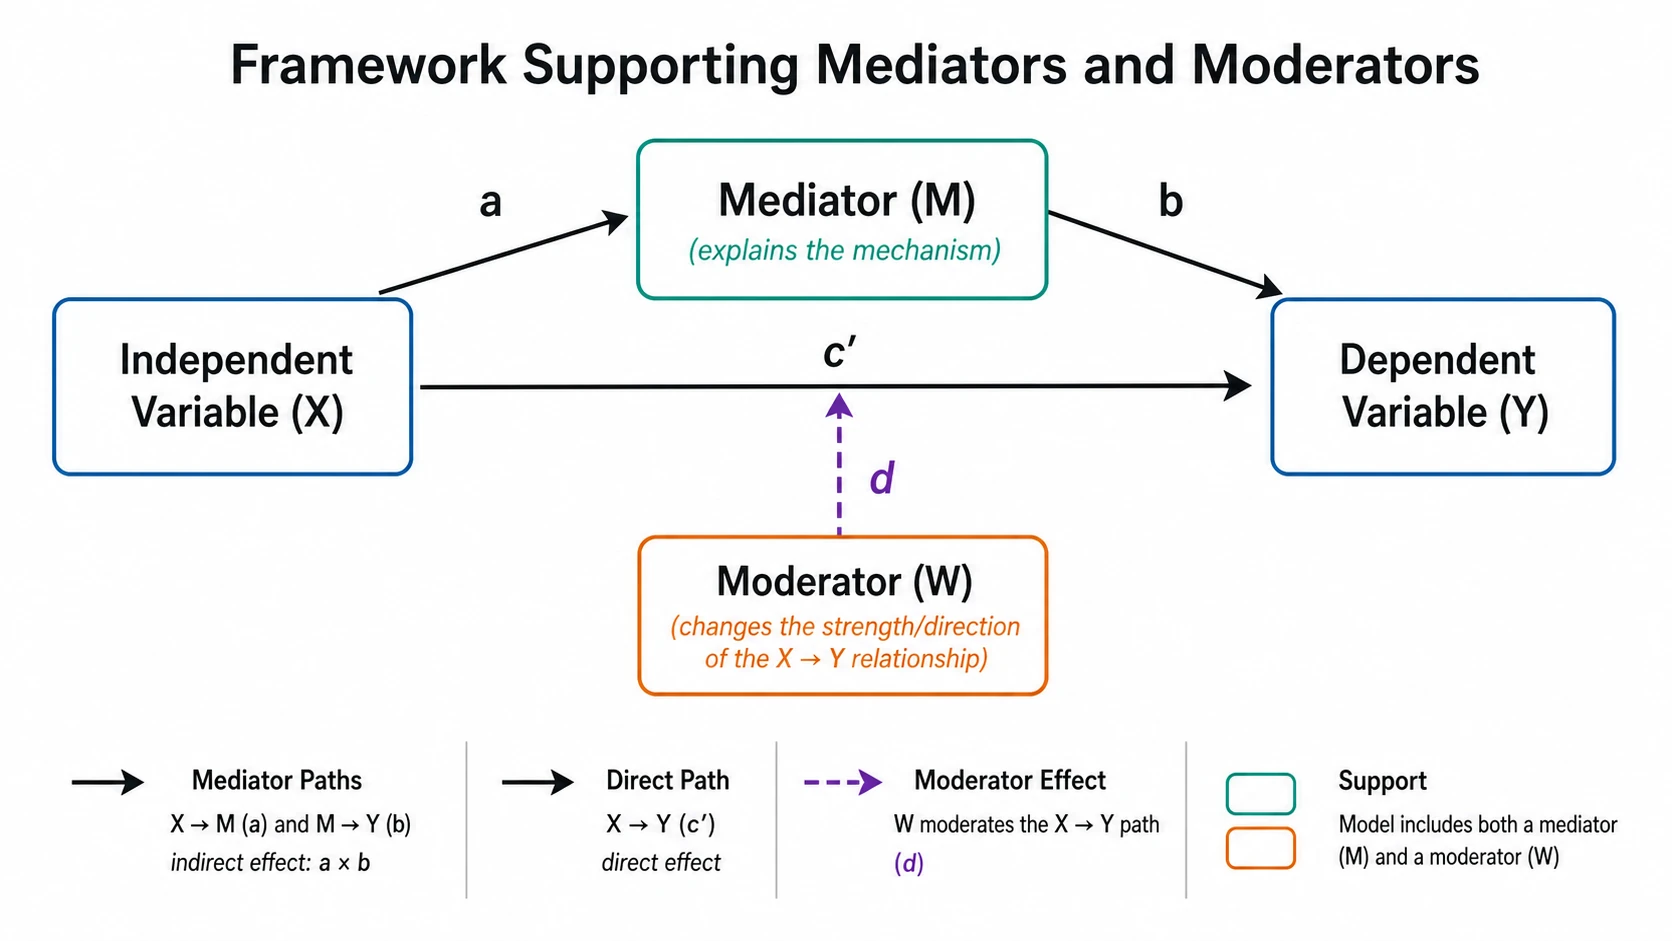
Show direct effects, mediated paths, moderation, and combined models clearly.
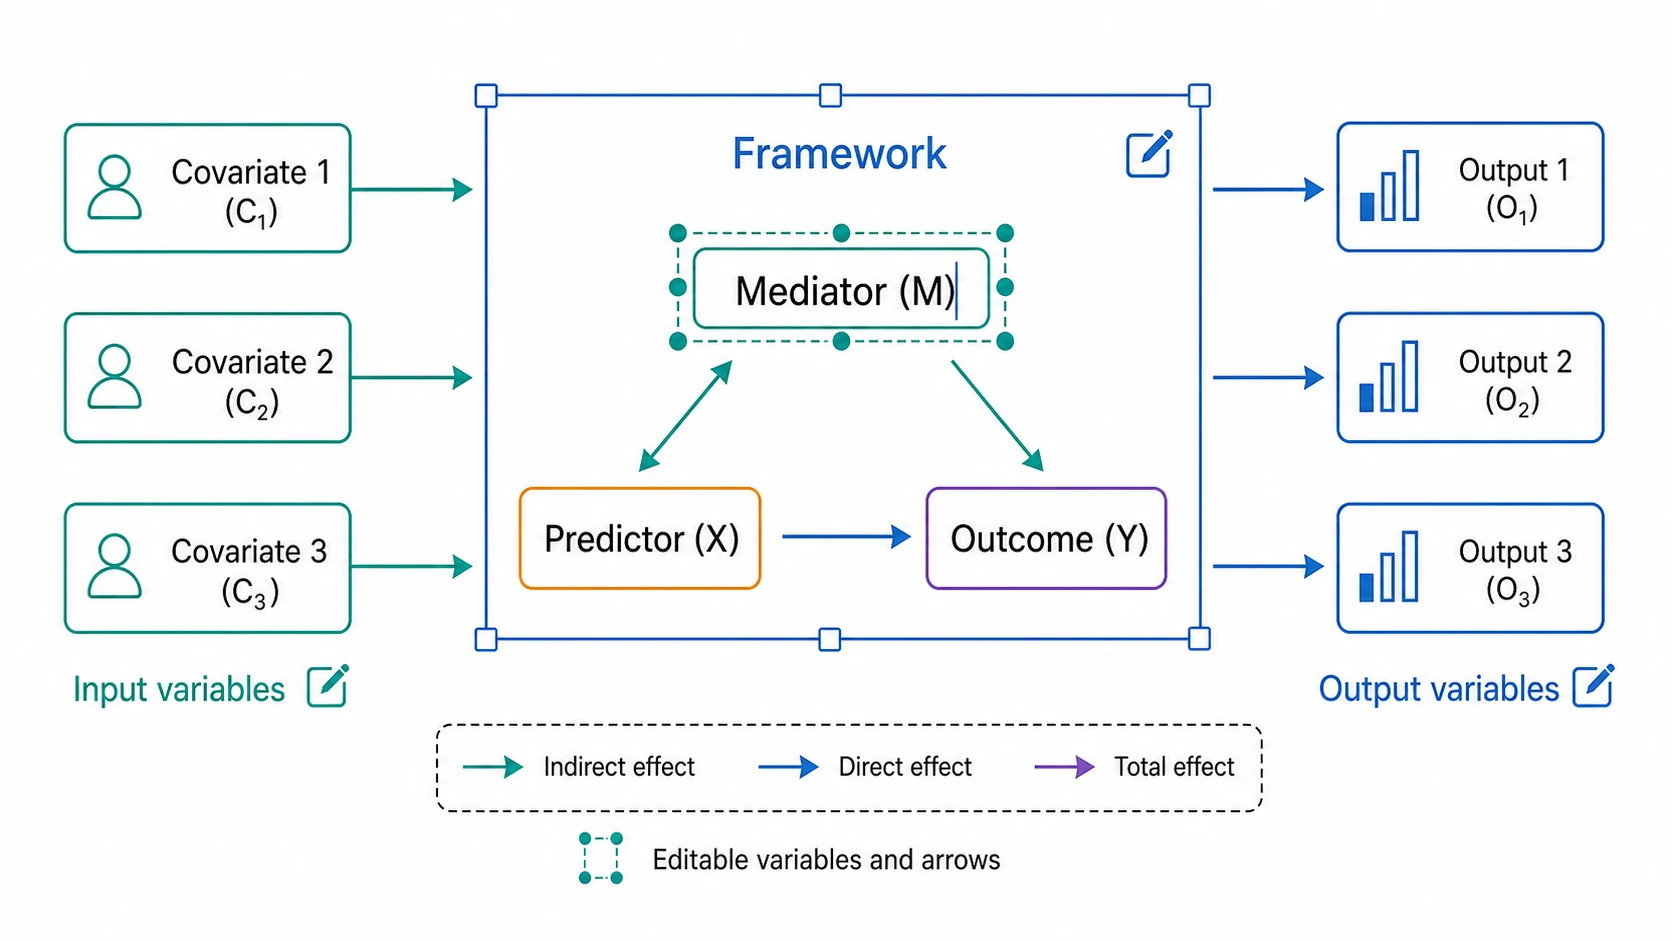
Refine variable names, relationship directions, colors, and layout for the final study.
List your independent, dependent, mediating, and moderating variables.
The AI drafts your conceptual framework diagram with labeled boxes and arrows.
Edit nodes, arrows, labels, and layout to match your research design.
Export as SVG or a high-resolution image for your thesis.
A conceptual framework is a visual diagram of the variables in your study and the relationships you hypothesize between them. It typically includes independent variables, dependent variables, mediators, and moderators connected by directional arrows. The diagram serves as a roadmap for your methodology and helps readers understand your research design at a glance.
Continue your research figure workflow