Biology
Biology illustrationCell-signaling pathway
Research figure tool
Turn a description into an accurate, labeled scientific illustration for your paper, grant, or poster. The AI drafts a clean figure in minutes — edit every element and export as vector SVG.
CV-2 Standard · 16:9
diagram
Try an example
Start from an example across biology, chemistry, medicine, and earth science. Click any prompt to load it into the generator and adapt it to your own study.
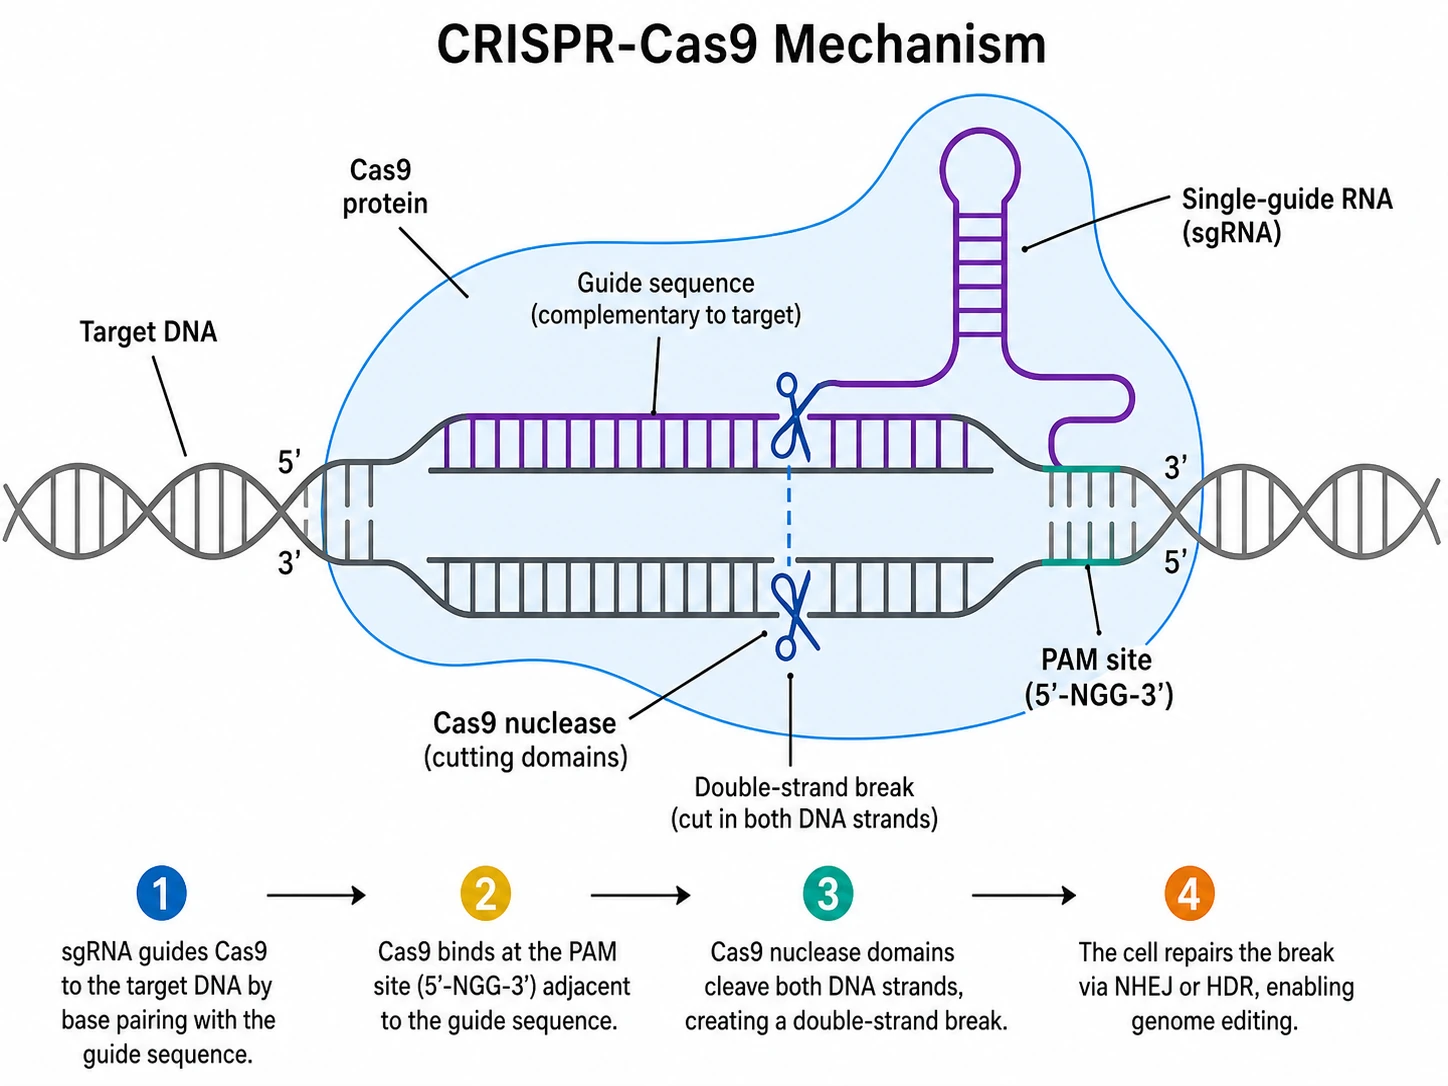
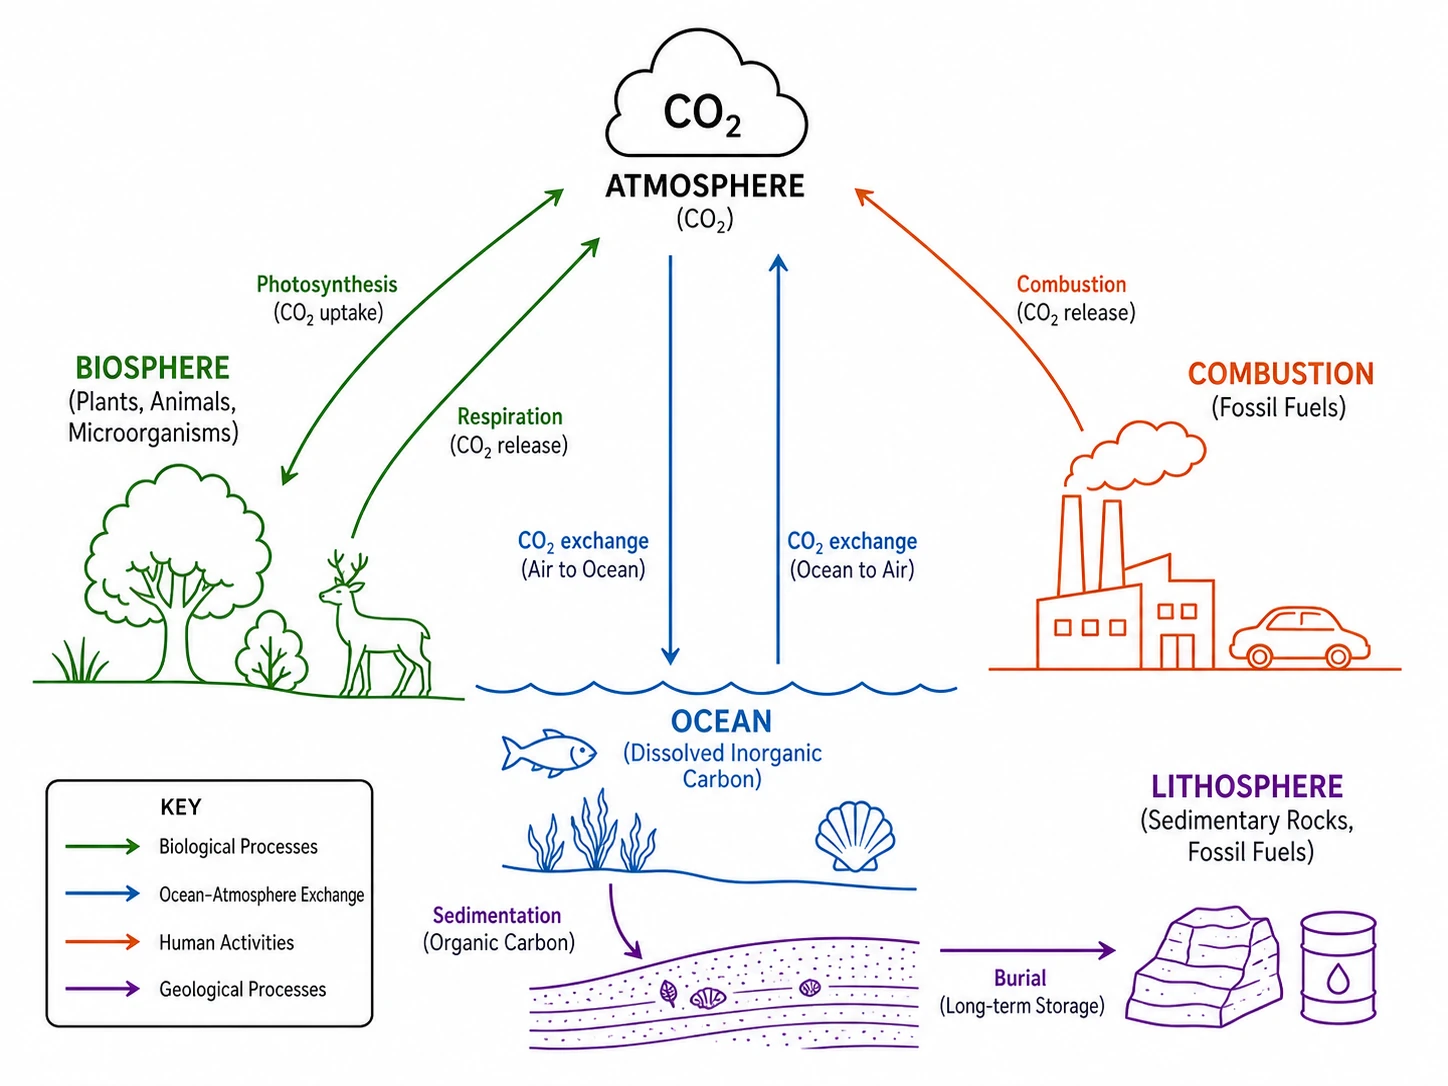
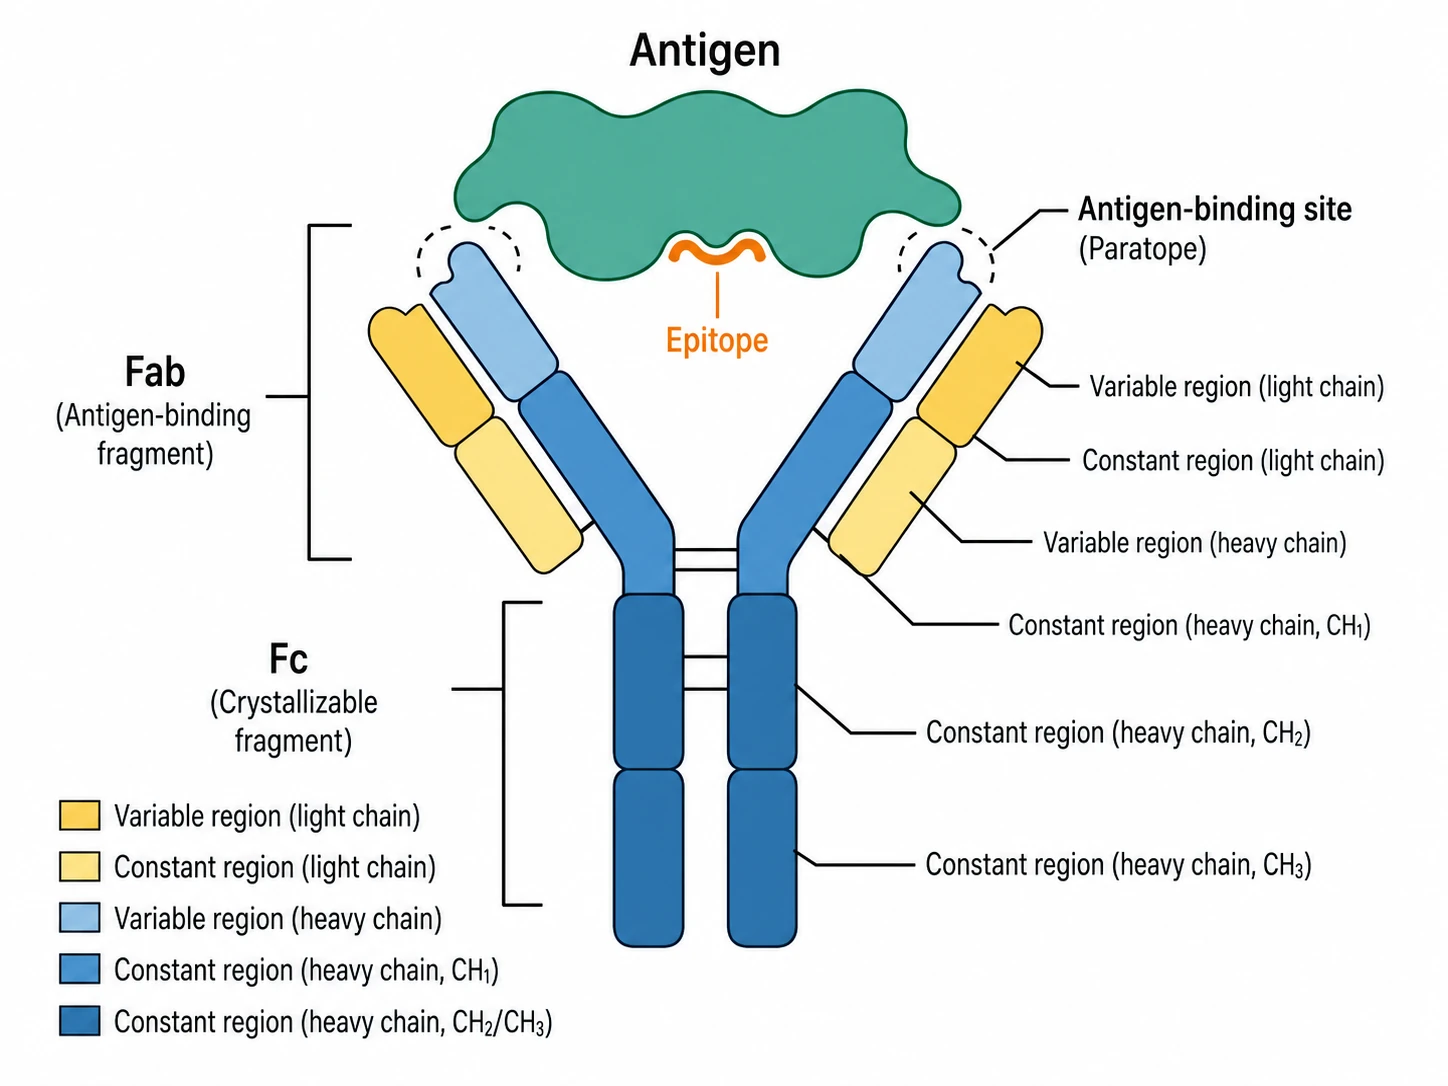
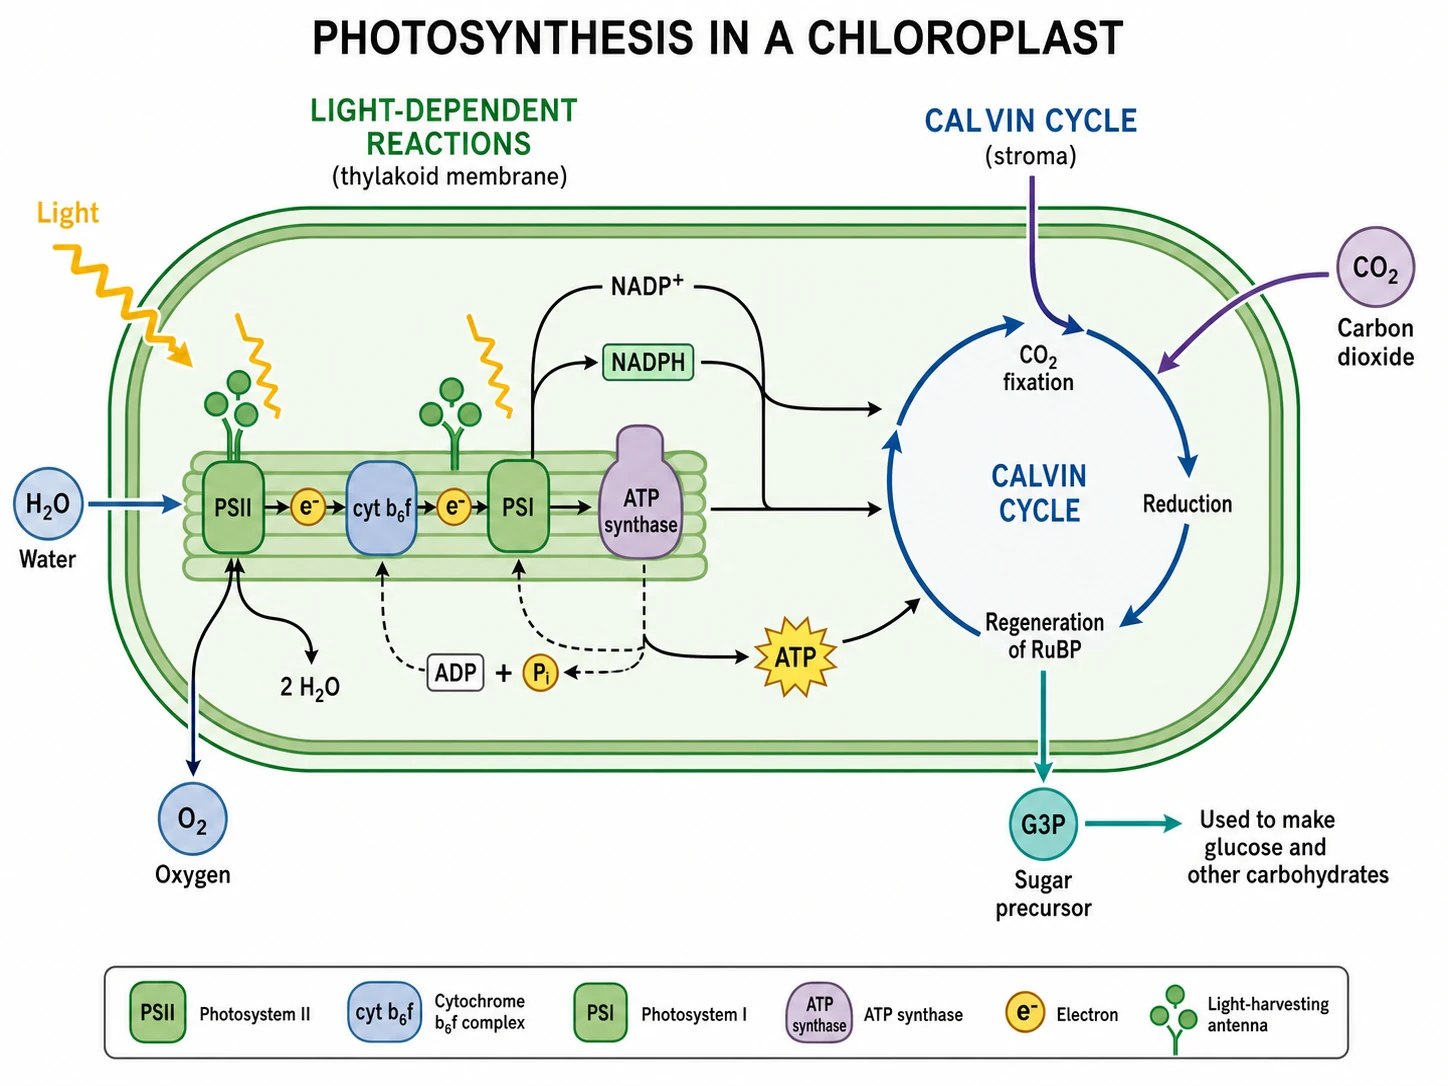
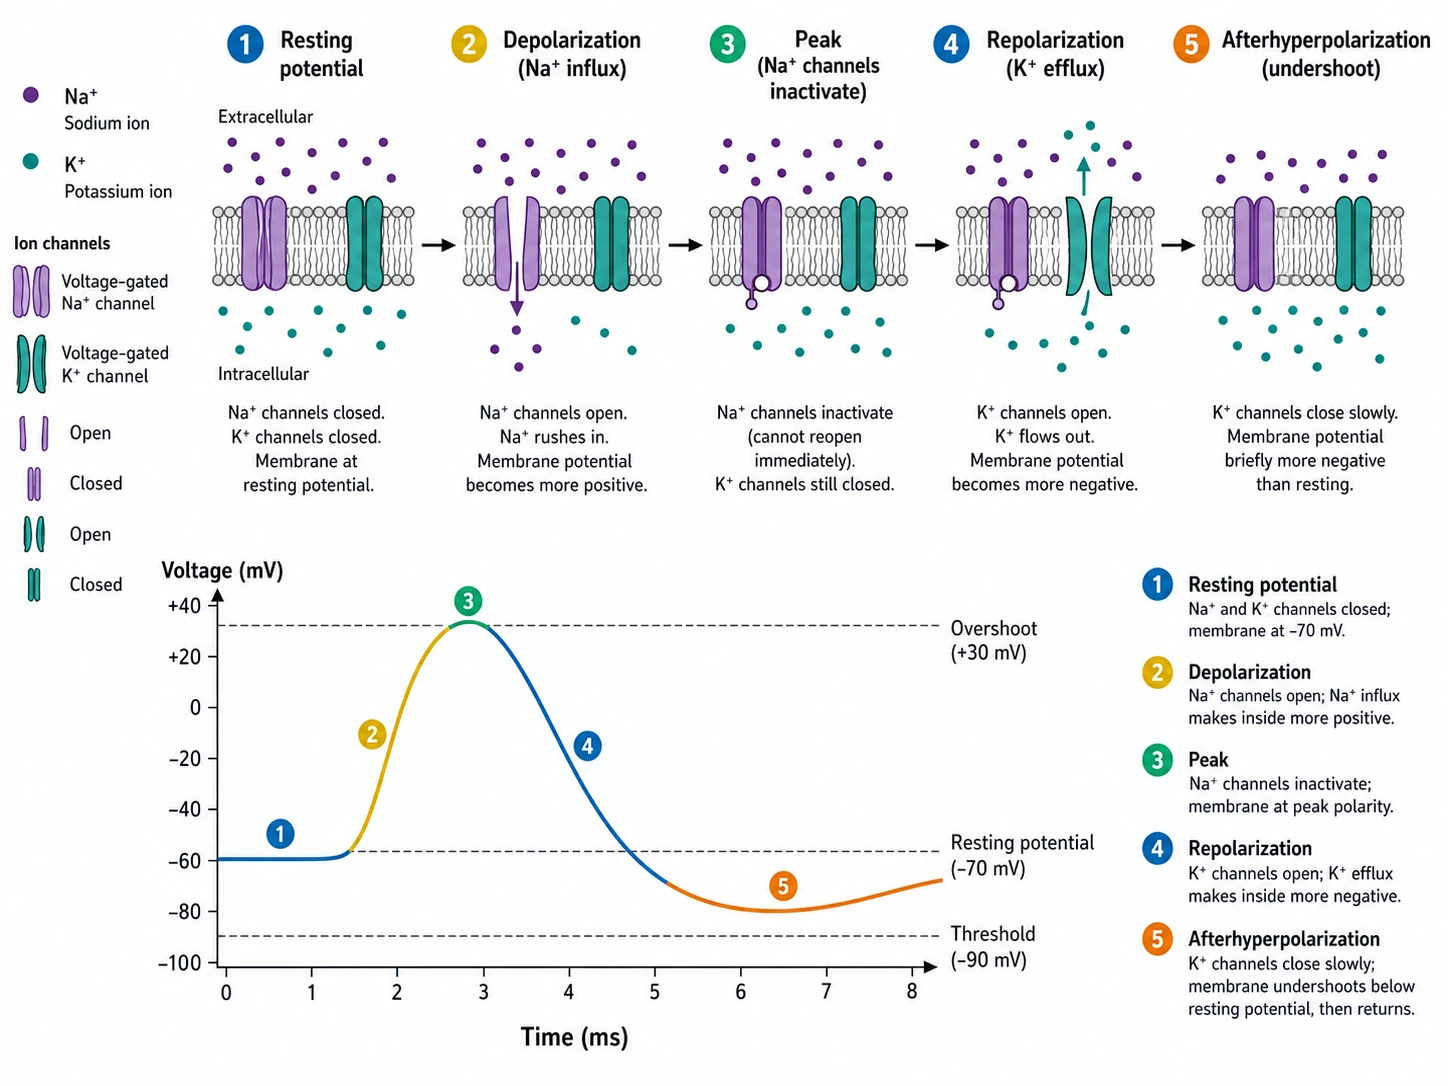
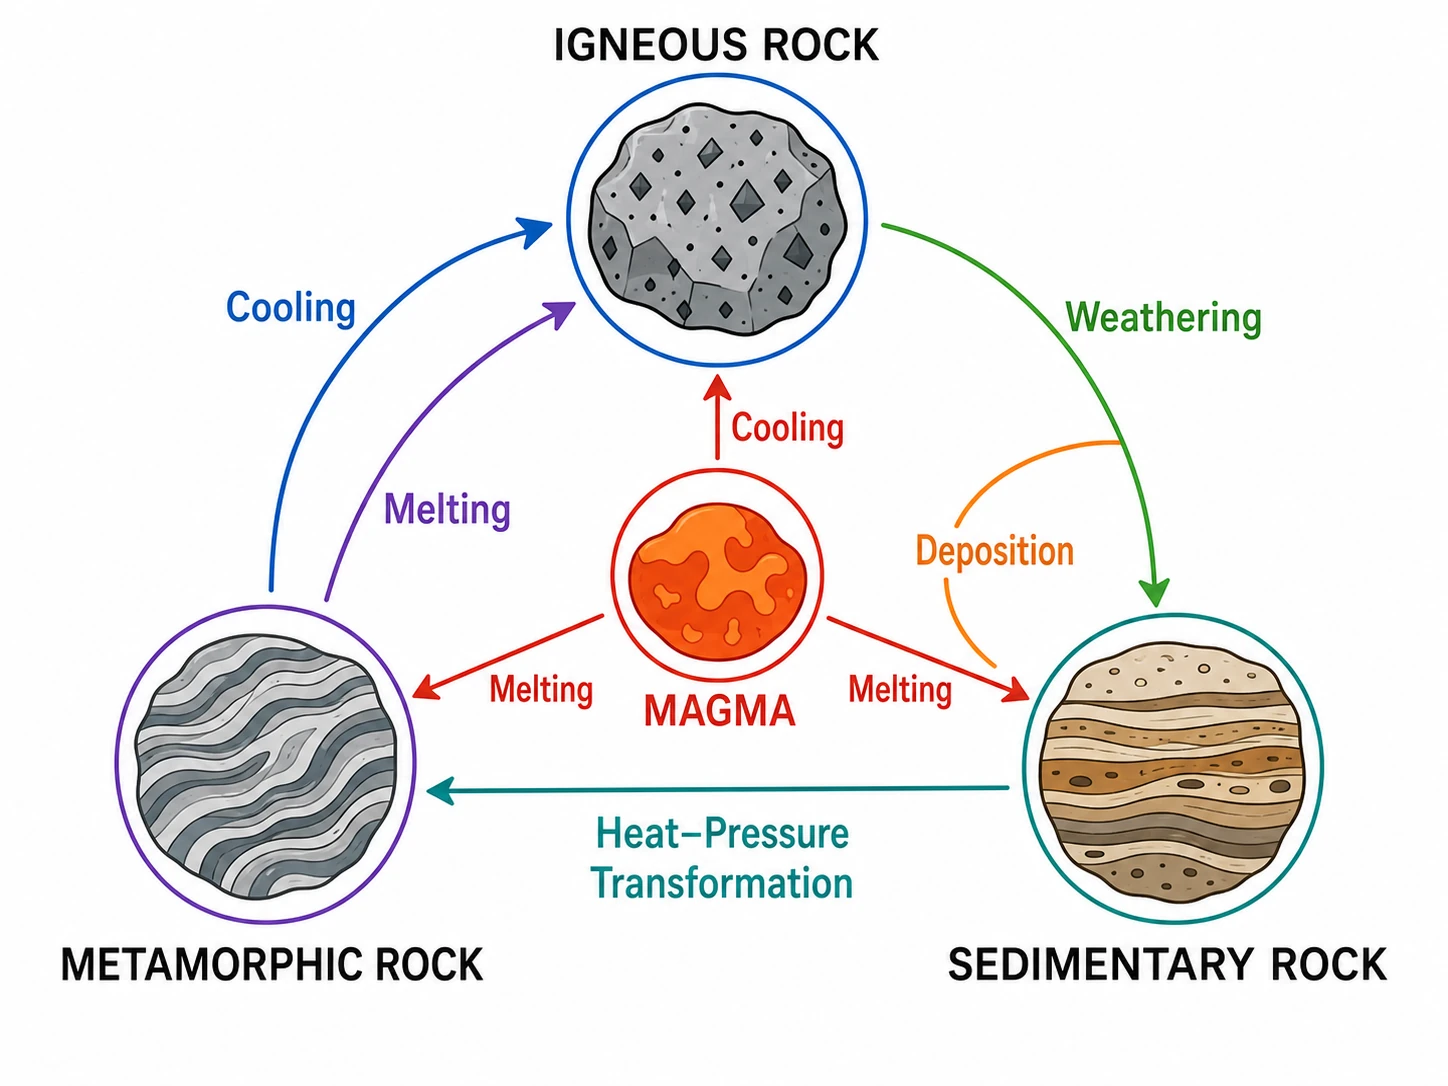
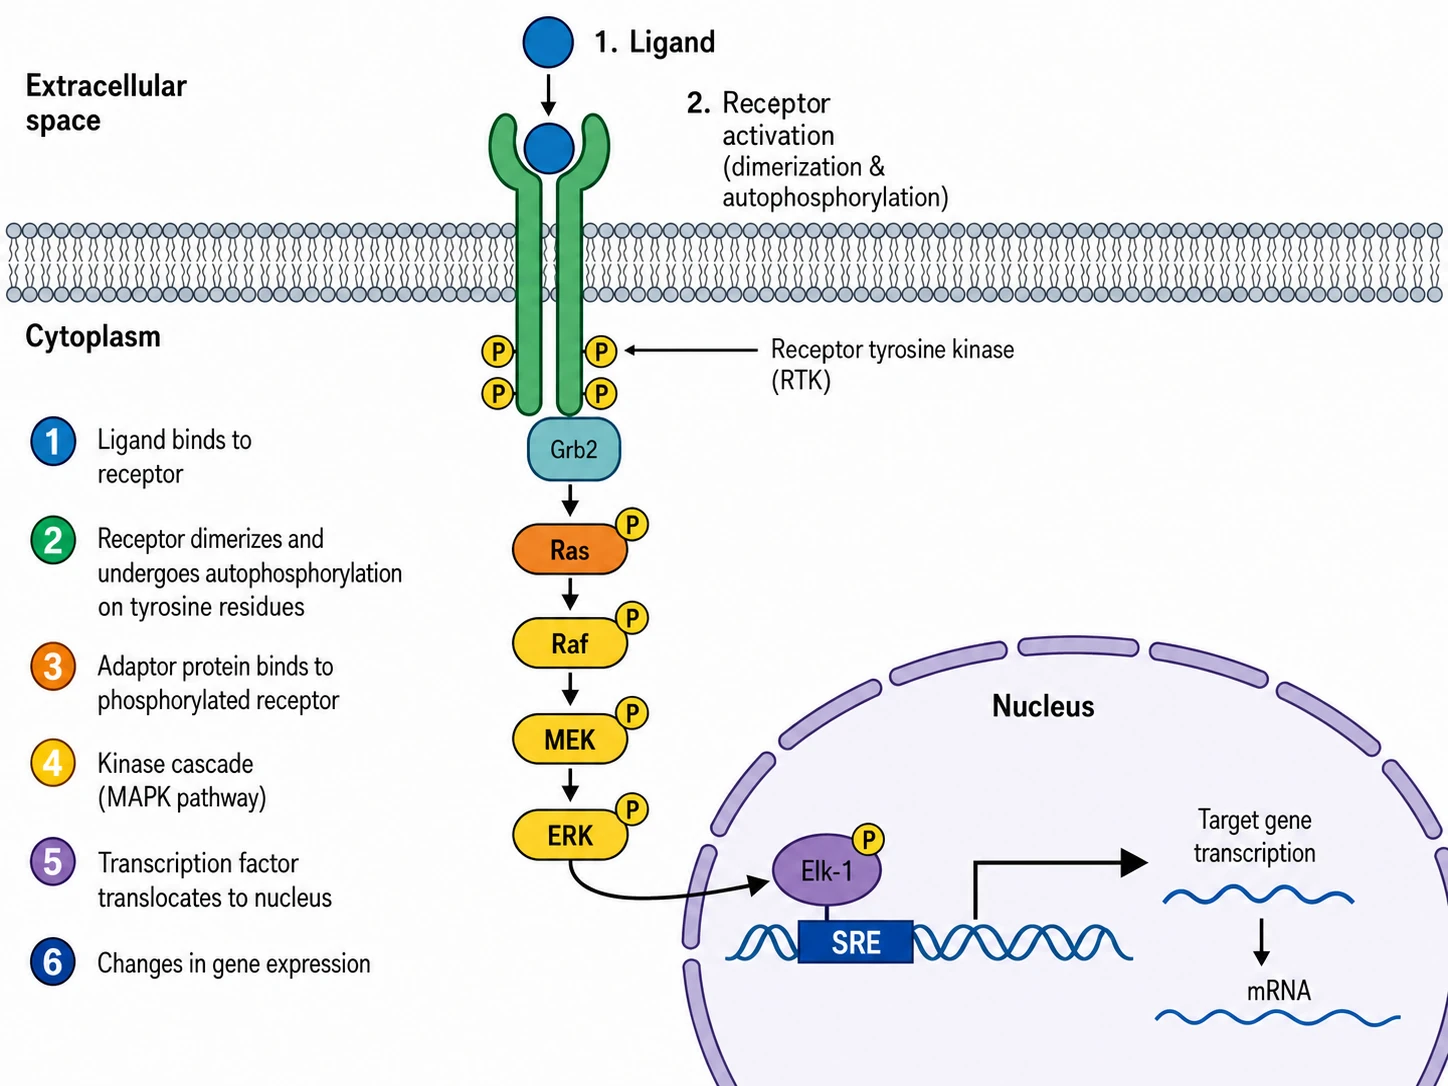
A scientific illustration is a figure that explains a structure, process, or mechanism accurately enough to appear in a paper, textbook, grant, or poster. Unlike a decorative image, every element carries meaning: parts are labeled, spatial relationships are correct, and the visual flow matches the underlying biology, chemistry, or physics. Reviewers and readers rely on these figures to understand your work quickly, so clarity and accuracy matter more than artistic polish. A good scientific illustration turns a paragraph of dense methods or results into something a reader grasps in seconds.
Scientific illustration software supports the full research workflow: a mechanism figure in the results section, a methods schematic showing an experimental setup, a summary diagram in a grant proposal, a labeled structure in a lecture slide, or a central visual on a conference poster. Journals increasingly expect clear original figures rather than reused textbook images, and grant reviewers benefit from a single figure that makes a complex aim legible. The faster you can produce an accurate, editable illustration, the more of these you can make without outsourcing the artwork.
The usual options each have a cost. Commissioning custom artwork can be accurate but slow and expensive, and every revision means another round-trip. Stock clip art is cheap but generic, rarely matches your exact structure, and looks obviously borrowed. Drawing it yourself in PowerPoint or Illustrator takes hours and looks it. With this scientific illustration generator you describe the structure or process, get a labeled draft in minutes, edit any element, and export a vector file you can revise again whenever a reviewer asks for a change.
General-purpose AI image tools optimize for aesthetics and routinely produce garbled text, invented anatomy, and meaningless labels — unusable in a scientific context. This generator creates labeled scientific or technical illustrations for research communication: it drafts structured figures where parts are named and arranged to reflect the science you describe, not stylized filler. Because every label, arrow, and shape stays editable, you can verify each detail against your data before it goes into a manuscript. Always review the draft for scientific accuracy; the tool is designed to make that review fast, not to replace your expertise.
Different fields expect different visual conventions. Molecular and cell biology favor schematic pathways with receptors, organelles, and directional arrows. Chemistry leans on structures, reaction arrows, and mechanism steps. Medicine uses labeled anatomy and physiological processes. Earth and environmental science relies on cross-sections and cycle diagrams. The generator applies discipline-aware layouts so a nephron looks like a nephron and a reaction mechanism reads left to right, giving you a starting point that already follows the conventions reviewers expect.
Papers and posters need figures that share a visual language: consistent line weights, a limited palette, and readable labels at final print size. Because output is vector SVG, illustrations stay sharp from a thumbnail to an A0 poster and can be recolored or relabeled to match a figure set. When a reviewer asks you to rename a structure or split a panel, you edit the existing file instead of rebuilding from scratch — the same figure carries from first submission through revision to the published version.
The workflow is deliberately short: write one or two sentences describing the structure or process, let the AI draft a labeled illustration, then refine labels, colors, and arrangement to match your data. Export as vector SVG for editing or high-resolution PNG for a slide, at the size your target venue requires. What used to be an afternoon of drawing — or a week of waiting on outsourced artwork — becomes a focused ten-minute task you control end to end.
Cell-signaling pathway
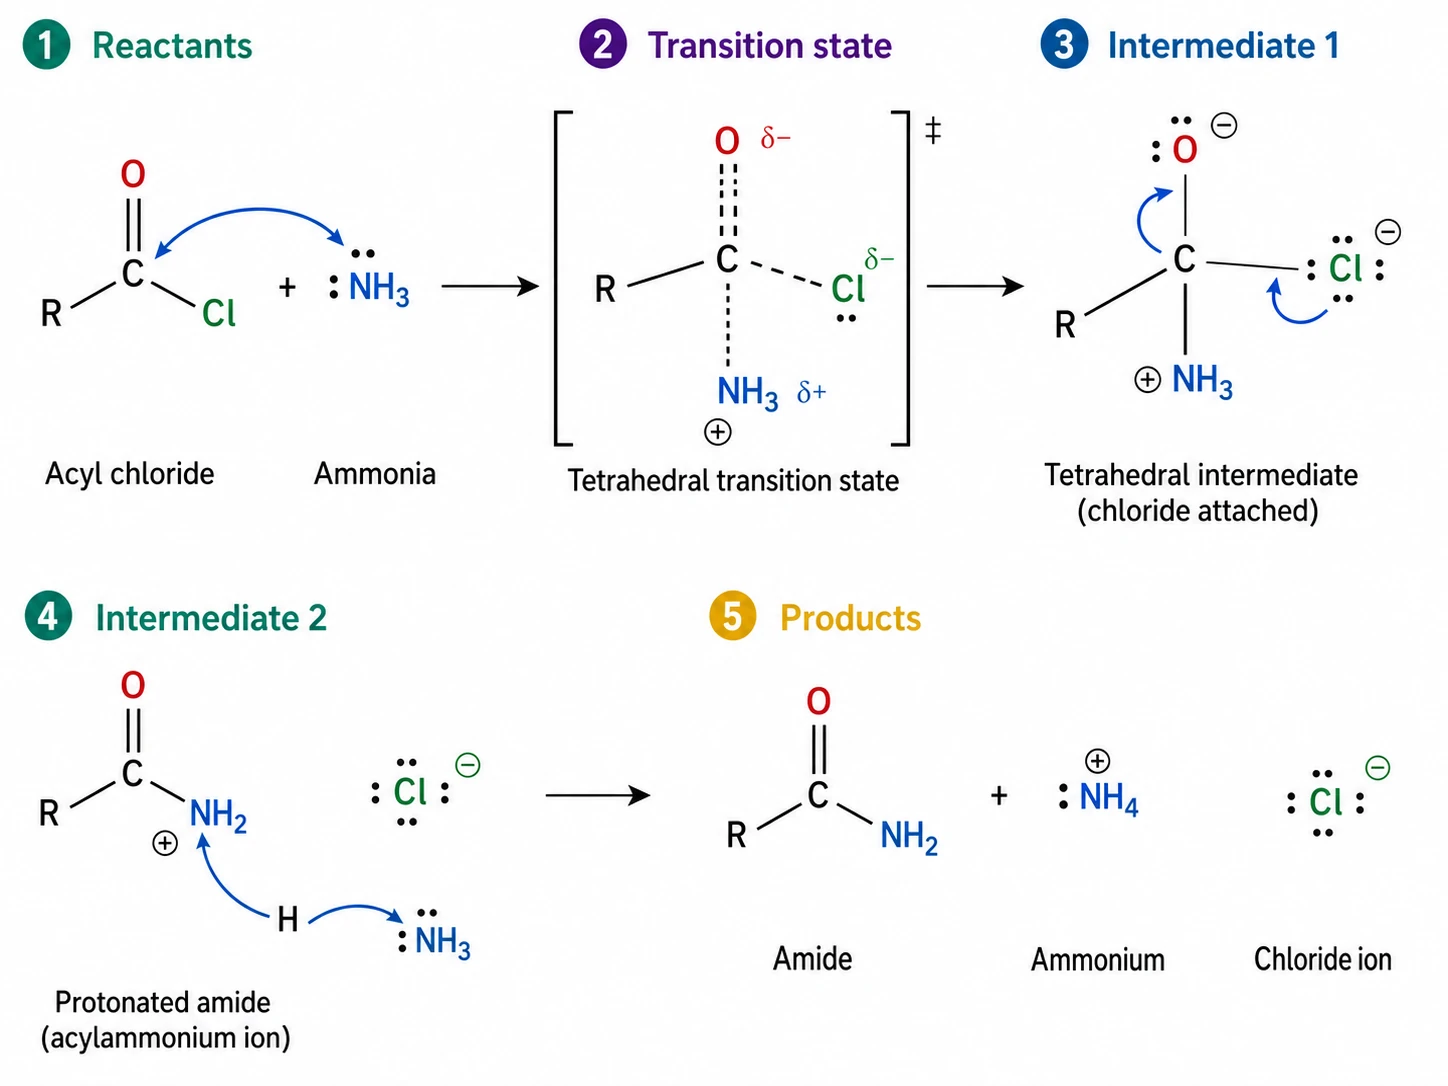
Reaction mechanism
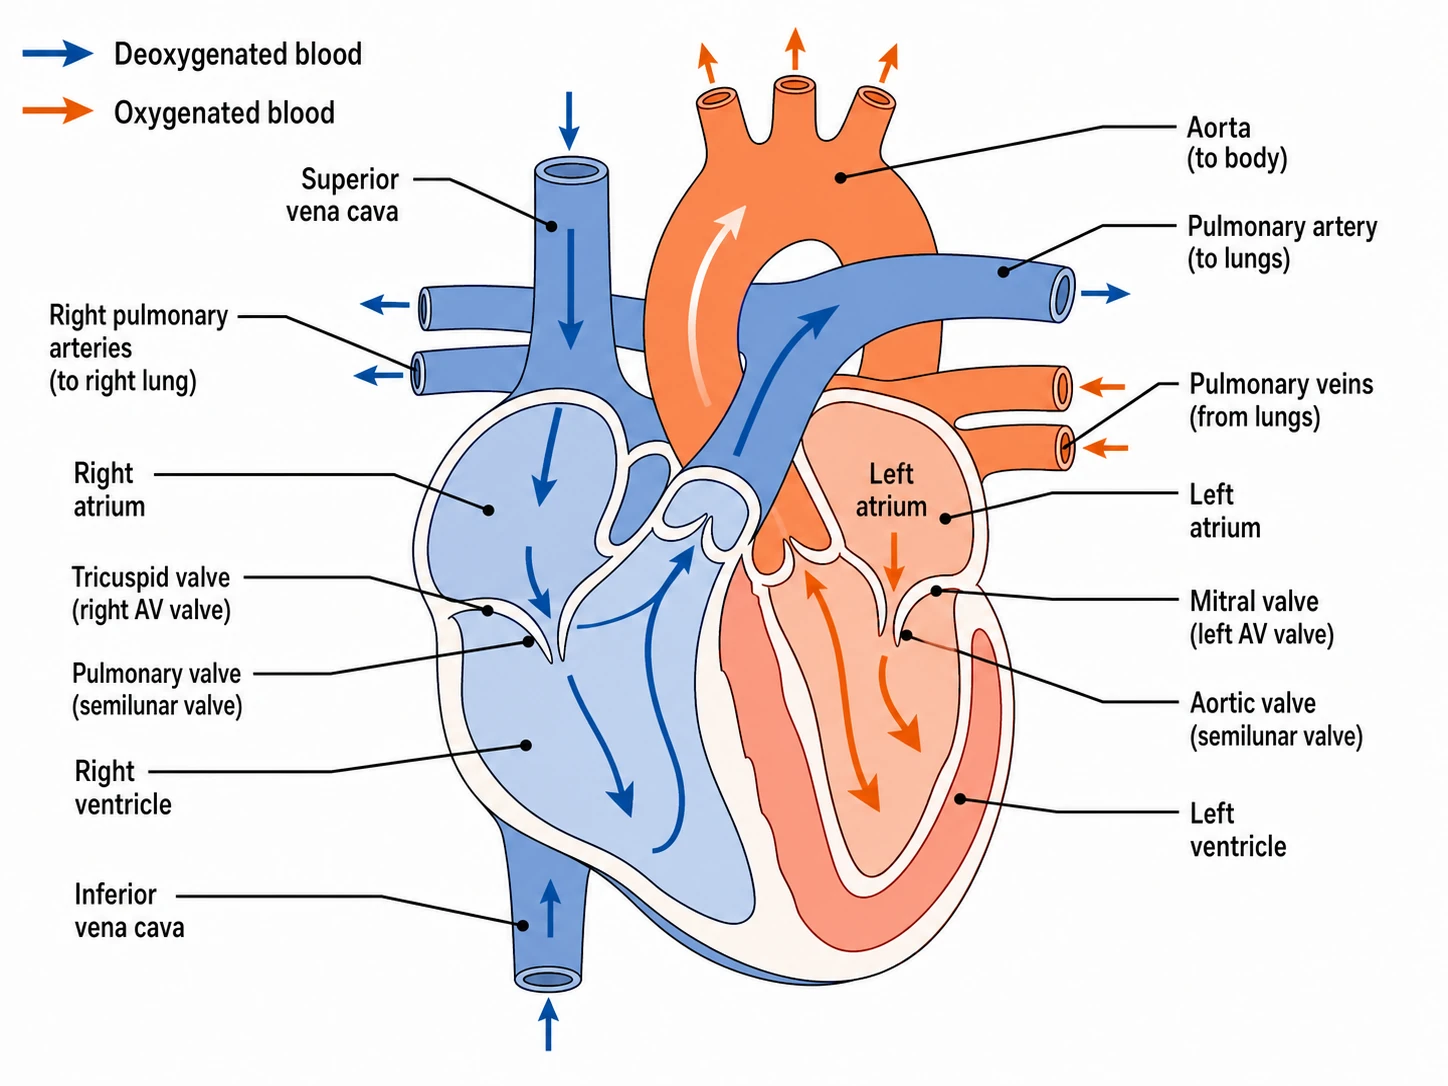
Anatomy and clinical figure
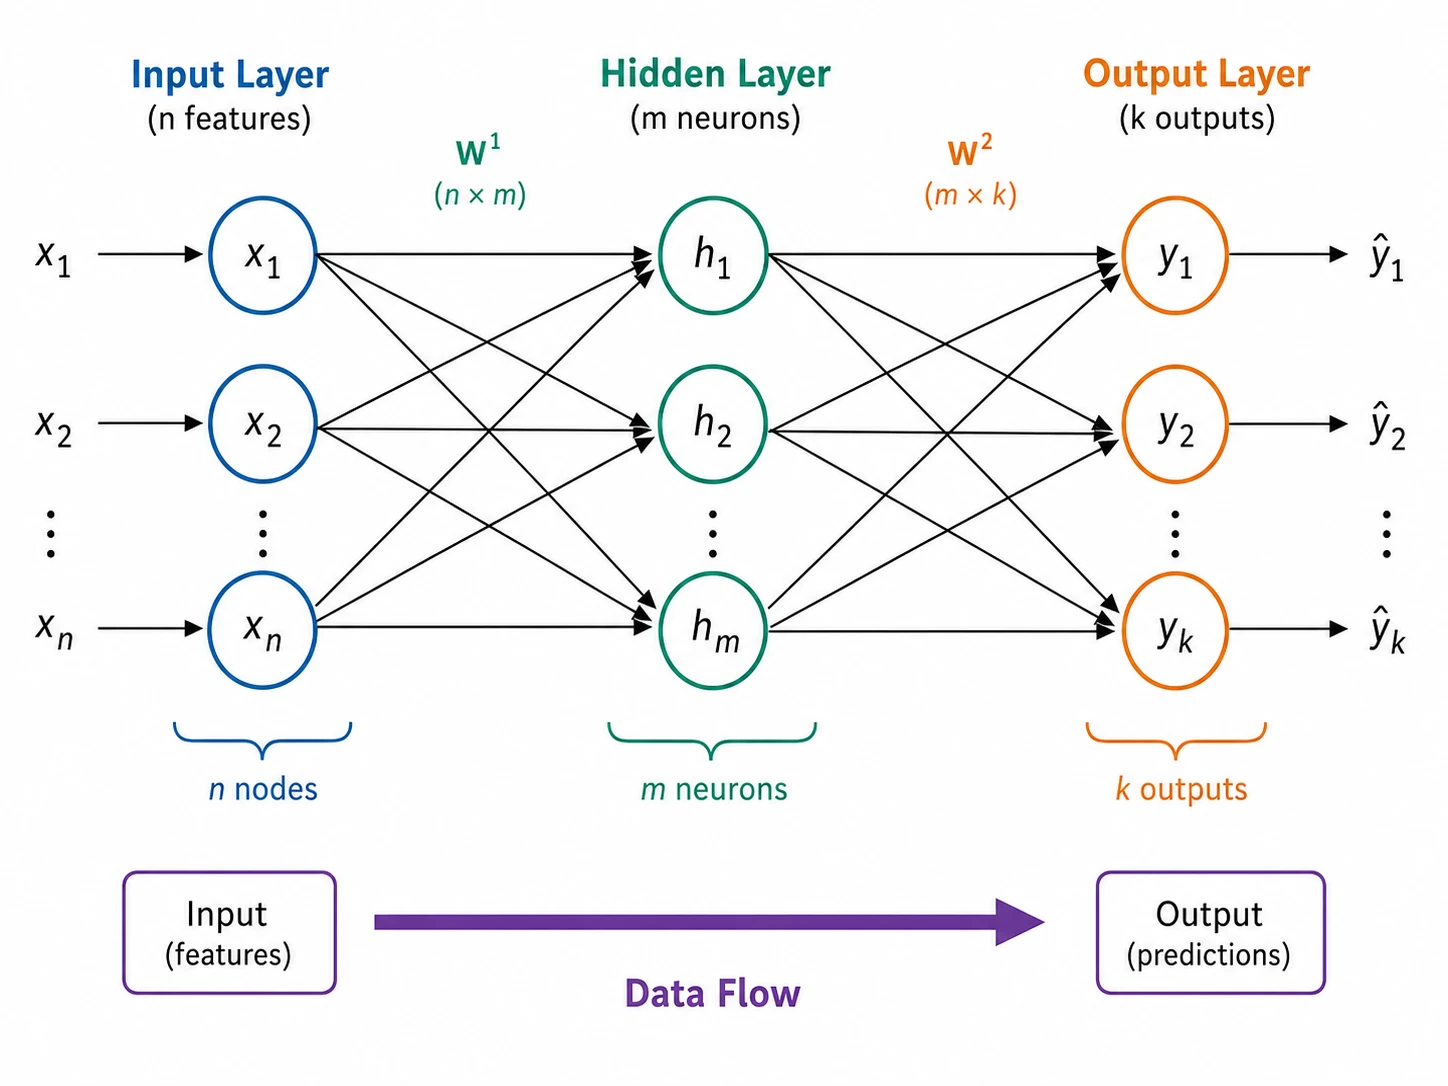
Architecture and model diagram
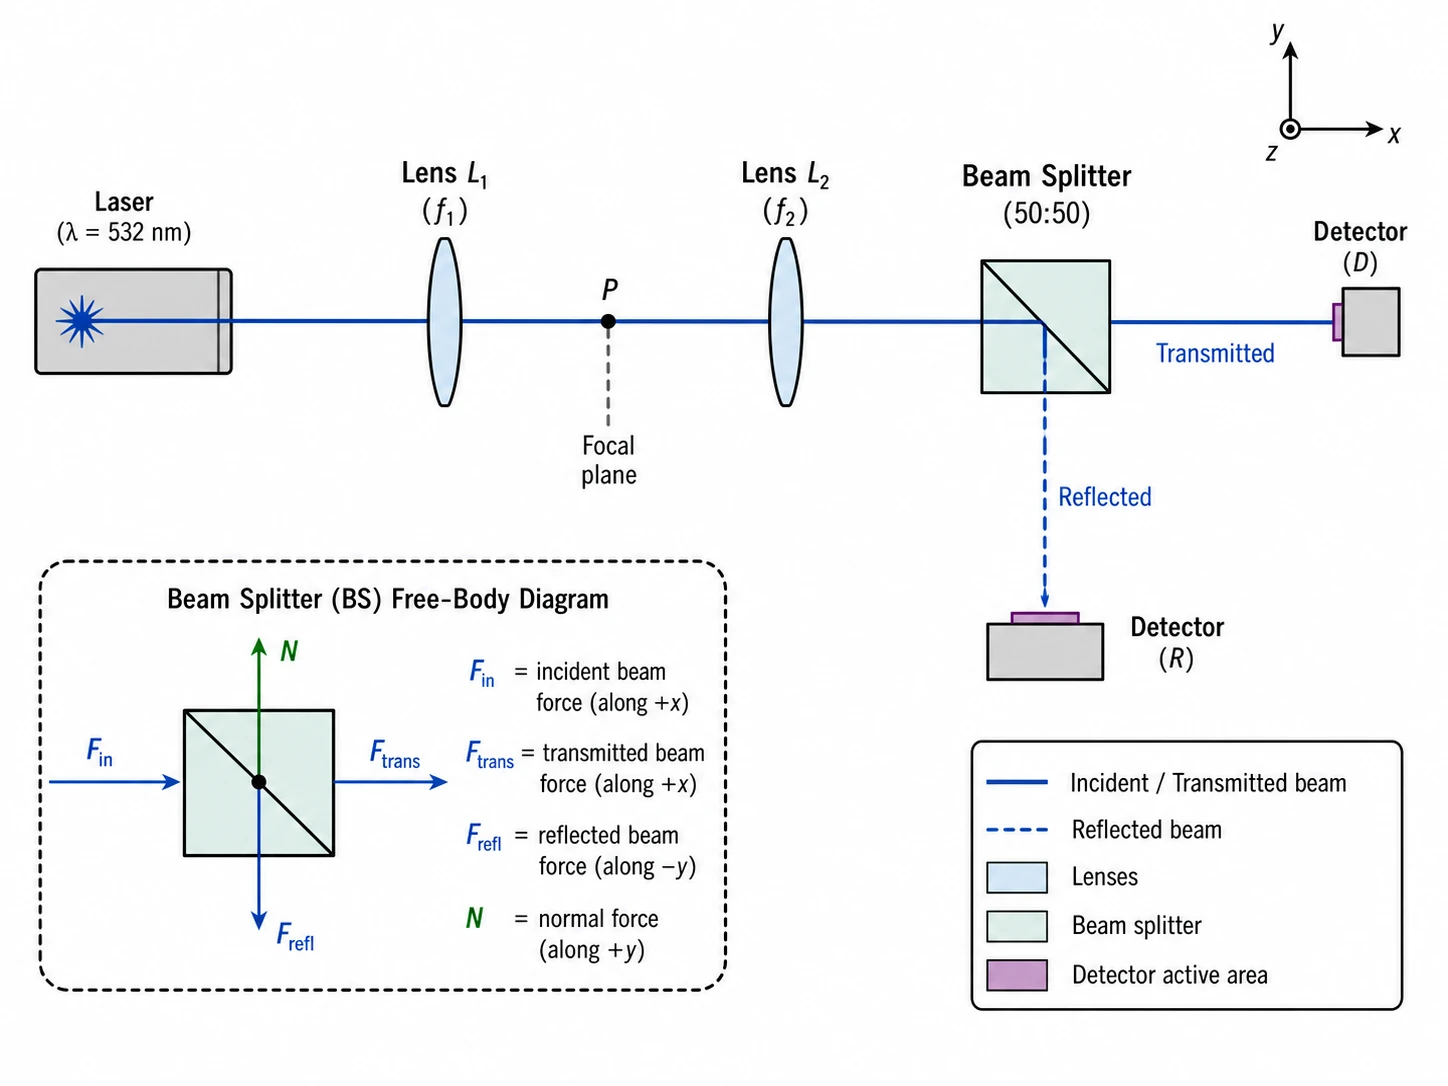
Apparatus and force diagram
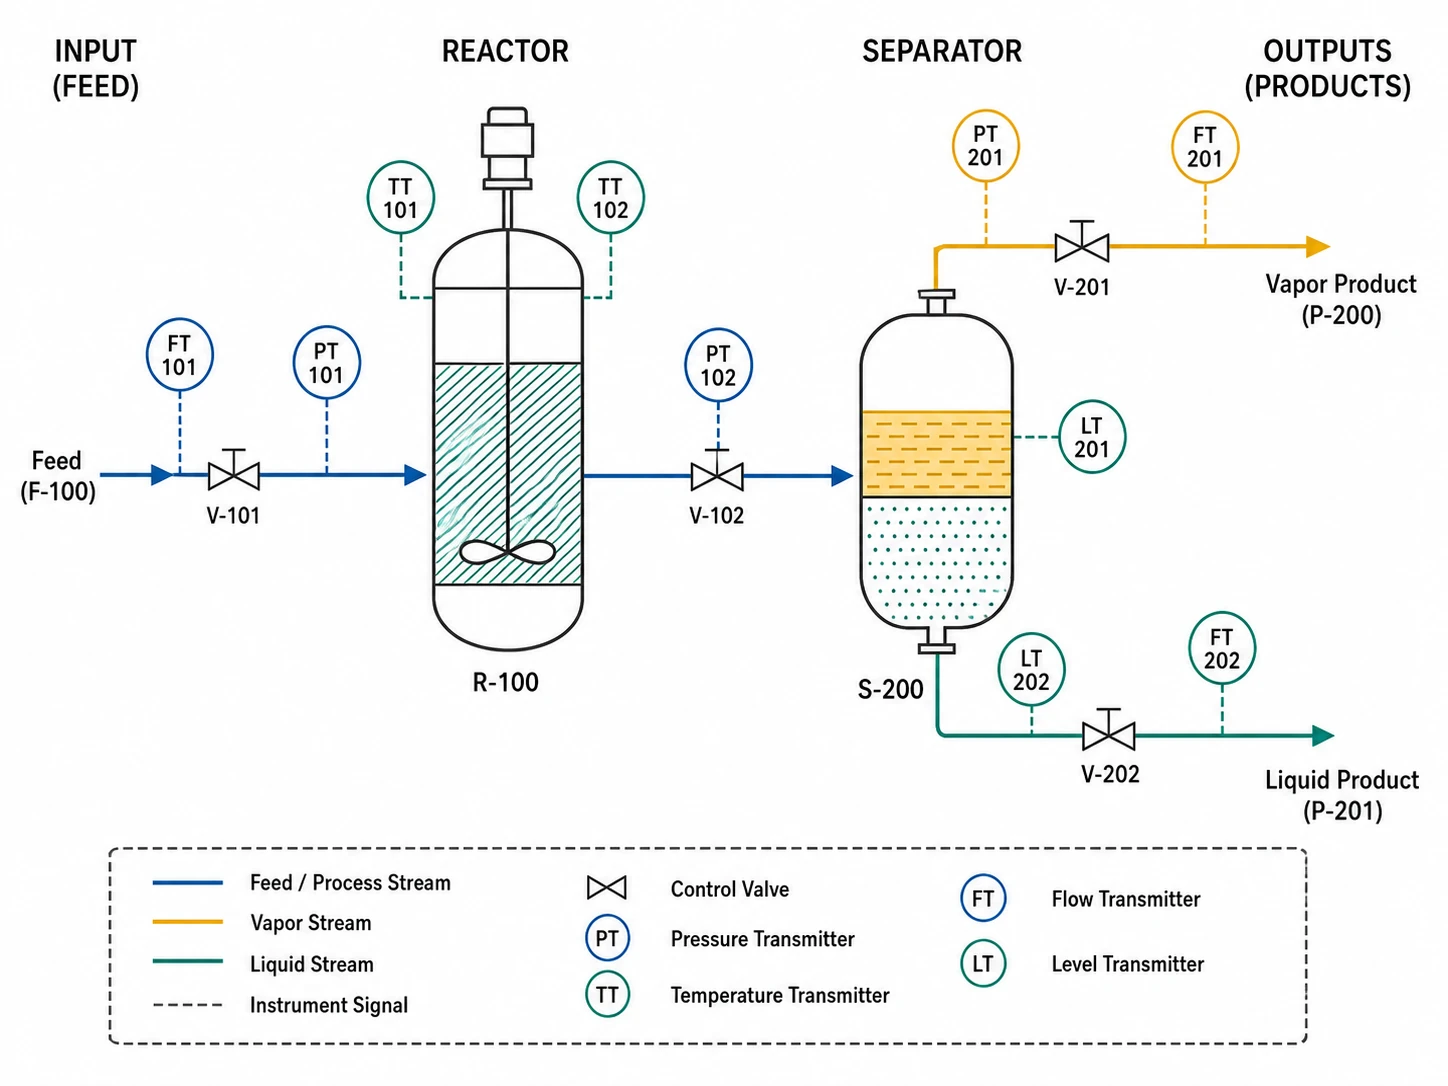
System and process flow
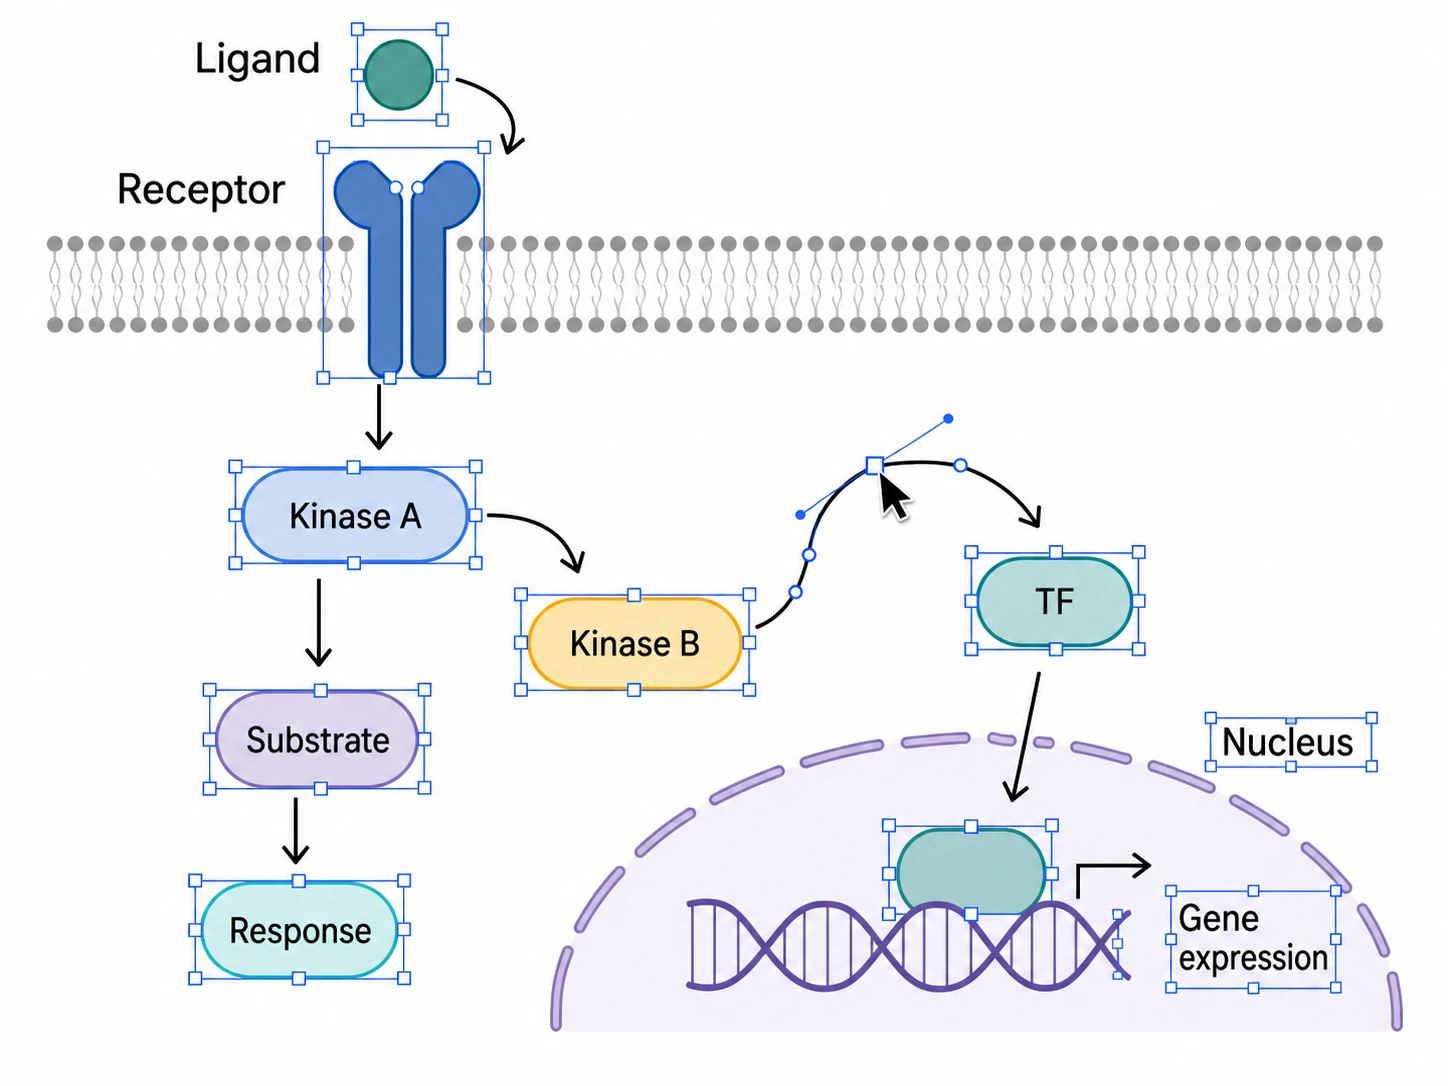
Adjust labels, nodes, arrows, and colors individually in a vector workflow.
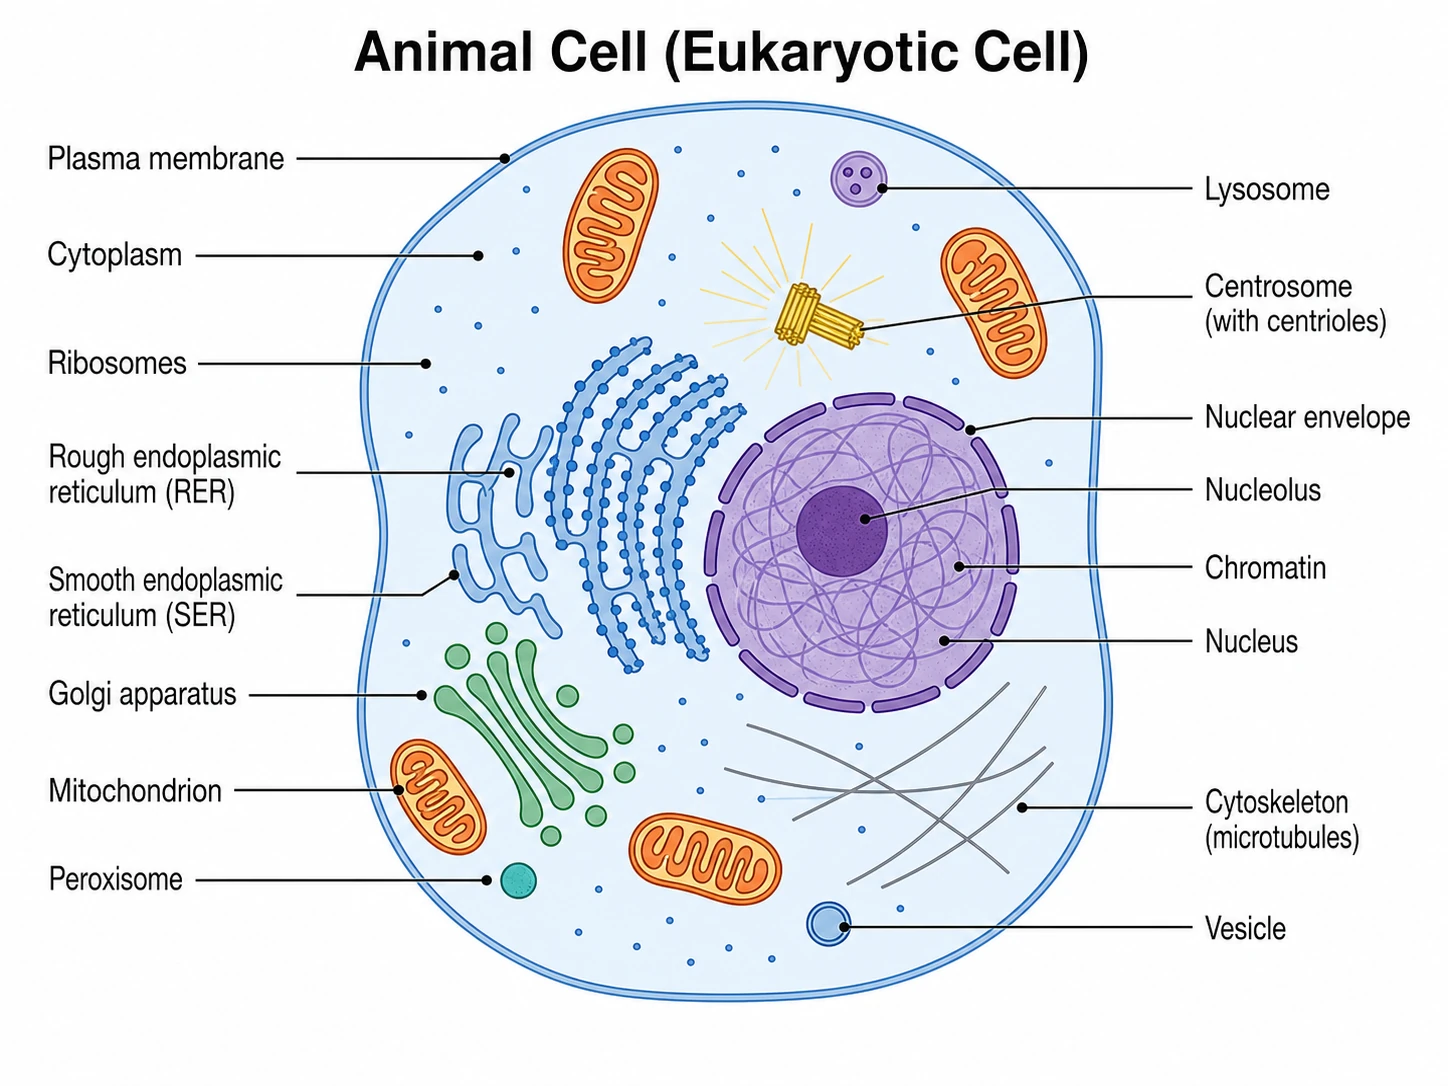
Show key parts and spatial relationships with structured labels and clean callouts.
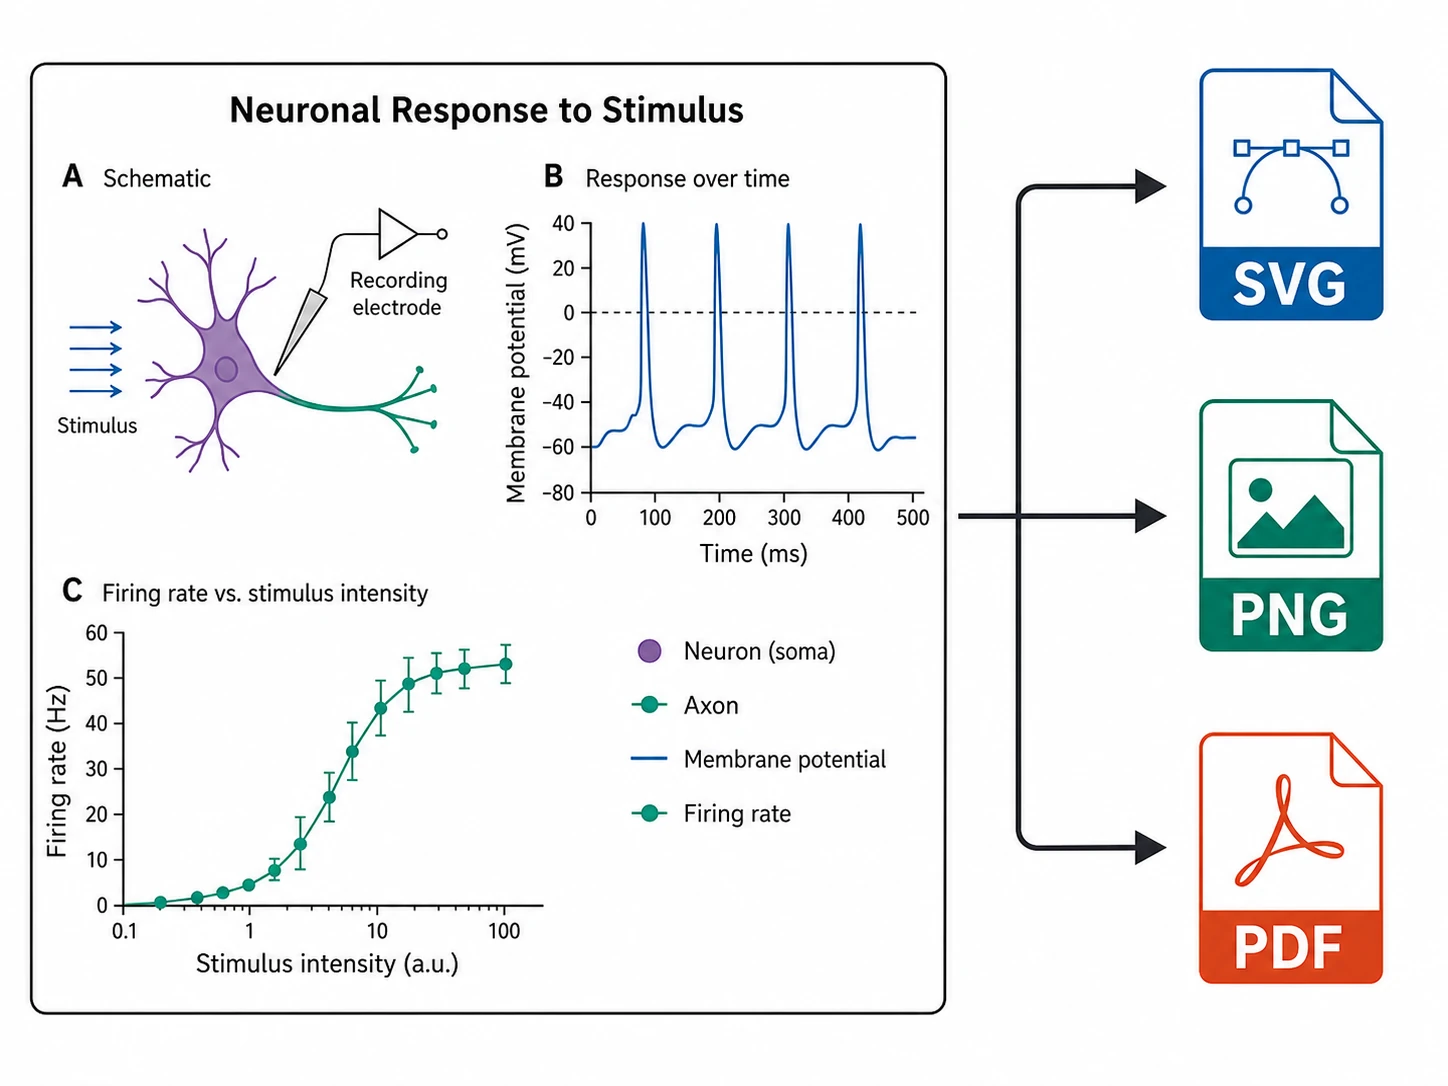
Export SVG, PNG, or PDF for papers, posters, and presentations.
Describe the structure or process you want to show.
The AI drafts a labeled scientific illustration with a discipline-aware layout.
Edit labels, colors, arrows, and arrangement to match your data.
Export as vector SVG or high-resolution PNG at the size you need.
A scientific illustration is an accurate, labeled figure that explains a structure, process, or mechanism for a paper, grant, poster, or lecture. Every element is meaningful — parts are named and spatial relationships are correct — rather than decorative.
Related research figure tools